5 myths and misunderstandings about investing in the stock market 🤷🏻♂️

Source: https://www.tker.co/p/stock-market-investing-myths-and-misunderstandings
Much of what we know about the stock market comes from a mix of theory and empirical evidence.
주식 시장에 관해 우리가 알고 있는 많은 부분은 이론과 실증적 증거의 조합에서 비롯됩니다.
For example, the idea that earnings drive stock prices is supported by the view that a business’s value is tied to how much money it makes. And decades of market data show that stock prices and earnings have exhibited a tight correlation.
예를 들어, 기업의 이익이 주가를 견인한다는 아이디어는 기업의 가치가 얼마나 돈을 버느냐와 직결된다는 시각에 의해 뒷받침됩니다. 그리고 수십 년간의 시장 데이터는 주가와 이익이 긴밀한 상관관계를 보여왔음을 증명합니다.
There are also ideas that make intuitive sense, but the evidence supporting them is shoddy. In the stock market, this is a big problem because people will trade on these ideas, only to underperform the market.
직관적으로는 말이 되지만 이를 뒷받침하는 증거는 부실한 아이디어들도 있습니다. 주식 시장에서 이는 큰 문제입니다. 사람들이 이러한 아이디어를 바탕으로 거래했다가 결국 시장 수익률을 밑돌게 되기 때문입니다.
Especially when it comes to price behavior, if a theory were both sound and reliable, we’d probably hear more about people consistently beating the market with some bulletproof trading strategy. But we don’t.
특히 가격 행태와 관련해, 만약 어떤 이론이 건전하고 신뢰할 수 있다면, 우리는 완벽한 거래 전략으로 꾸준히 시장을 이기는 사람들에 대한 이야기를 더 자주 들을 수 있을 것입니다. 하지만 그렇지 않습니다.
With that in mind, here are five ideas about the stock market that I’d describe as myths or misunderstandings.
이를 염두에 두고, 제가 미신이나 오해로 규정하고 싶은 주식 시장에 관한 다섯 가지 아이디어를 소개합니다.
1. Stock market returns revert to a mean 😵💫
Periods of strong stock market returns should be followed by periods of weak returns, and vice versa. Right?
주식 시장 수익률이 강세를 보이는 시기 뒤에는 약세를 보이는 시기가 오고, 그 반대도 마찬가지여야 합니다. 맞나요?
If you take a long-term chart of the stock market and add a trendline, you’ll see prices above the line for some time and below it most of the time. This makes it tempting to say that the market exhibits mean reversion, or a tendency to gravitate back toward some historical average.
주식 시장의 장기 차트를 가져와 추세선을 그려보면, 주가가 일정 기간 동안은 선 위에 있고 대부분의 시간 동안은 선 아래에 있는 것을 볼 수 있습니다. 이 때문에 시장이 평균 회귀(mean reversion), 즉 과거의 어떤 역사적 평균으로 다시 수렴하려는 경향을 보인다고 말하고 싶어지기 쉽습니다.
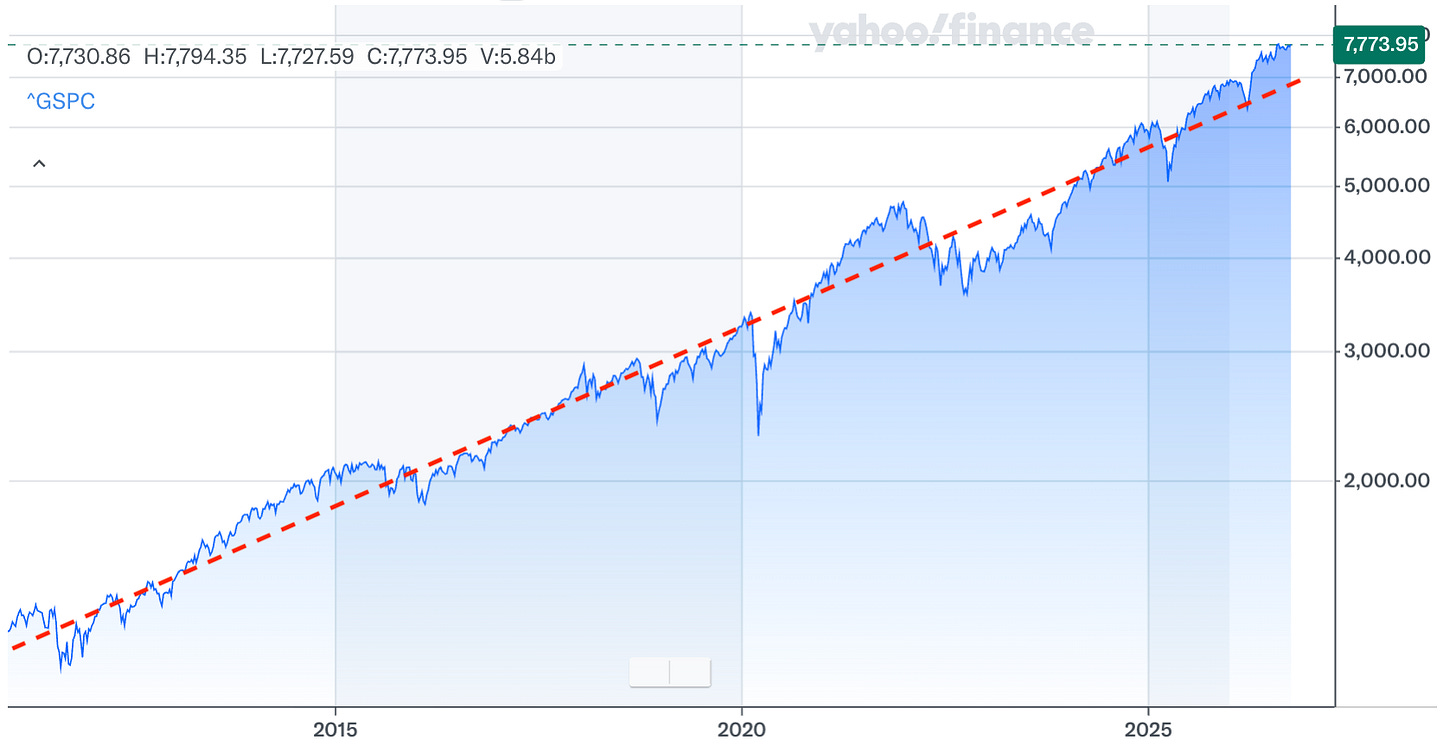
Unfortunately, this behavior is so inconsistent that Professors Paul Marsh, Mike Staunton, and Elroy Dimson concluded that “popular evidence for mean reversion is an ‘optical illusion’ that employs hindsight.” They addressed this issue in the 2025 edition of UBS’s “Global Investment Returns Yearbook” and also explored it at length in the 2013 edition, when Credit Suisse published it.
안타깝게도 이 현상은 너무나 일관성이 없어서, 폴 마쉬(Paul Marsh), 마이크 스톤턴(Mike Staunton), 엘로이 딤슨(Elroy Dimson) 교수는 “평균 회귀에 대한 대중적 증거는 사후적 해석을 활용한 ‘착시 현상’에 불과하다”고 결론지었습니다. 그들은 UBS의 '글로벌 투자 수익 연감(Global Investment Returns Yearbook)' 2025년판에서 이 문제를 다루었으며, 크레디트 스위스가 발행했던 2013년판에서도 이를 깊이 다룬 바 있습니다.
They even went so far as to compare the belief in mean reversion to the Gambler’s Fallacy, the assumption that past outcomes inform future ones.
그들은 심지어 평균 회귀에 대한 믿음을, 과거의 결과가 미래의 결과를 알려준다는 가정인 도박사의 오류(Gambler's Fallacy)에 비유하기까지 했습니다.
If mean reversion in the market were consistent and predictable, then there would be a way to trade the phenomenon in such a way as to generate above-average returns. But you don’t really hear about funds or traders consistently beating the market by trading the expectation of mean reversion. (Maybe some secretive hedge fund somewhere has figured it out and they’re not telling us.)
만약 시장의 평균 회귀가 일관되고 예측 가능하다면, 평균 이상의 수익을 창출하기 위해 이 현상을 이용해 거래하는 방법이 존재할 것입니다. 하지만 평균 회귀에 대한 기대를 바탕으로 거래하여 꾸준히 시장을 이기는 펀드나 트레이더에 대한 이야기는 잘 들리지 않습니다. (어쩌면 세상 어딘가의 비밀스러운 헤지펀드가 이를 알아내고 우리에게 말해주지 않고 있는지도 모릅니다.)
“Market-timing strategies based on mean reversion typically gave lower, not higher, returns,” Marsh, Staunton, and Dimson found.
“평균 회귀에 기반한 시장 타이밍 전략은 통상적으로 높은 수익률이 아니라 오히려 더 낮은 수익률을 냈다”는 사실을 마쉬, 스톤턴, 딤슨 교수가 발견했습니다.
That’s not too surprising when you see the various stats showing periods of strong returns are often followed by more strong returns. Indeed, history shows that investing at all-time highs has produced better returns than investing on all other days.
강세 수익률을 기록한 시기 뒤에 종종 더 강력한 강세가 이어진다는 다양한 통계를 보면 이는 그리 놀라운 일이 아닙니다. 실제로 역사는 사상 최고가일 때 투자하는 것이 다른 모든 날에 투자하는 것보다 더 나은 수익을 창출해 왔음을 보여줍니다.
Keep this in mind the next time someone suggests we’re “due” for weak returns because we just experienced strong returns. What just happened won’t tell you what’s coming next.
다음에 누군가 우리가 방금 강세를 겪었기 때문에 약세가 나타날 “때가 되었다”고 주장할 때 이를 명심하십시오. 방금 일어난 일은 다음에 무엇이 올지 말해 주지 않습니다.
Read more about this here.
2. Valuations revert to a mean 😵💫
One of the most popular ways to measure value is to divide an asset’s price by its earnings. This is the price-to-earnings (P/E) ratio. When a stock’s P/E is above its historical average, it’s considered expensive. When it’s below average, it’s considered cheap.
가치를 측정하는 가장 대중적인 방법 중 하나는 자산의 가격을 이익으로 나누는 것입니다. 이것이 바로 주가수익비율(P/E ratio)입니다. 어떤 주식의 P/E가 역사적 평균보다 높으면 비싸다고 간주되고, 평균보다 낮으면 싸다고 간주됩니다.
This has led many to assume that expensive stocks tend to get cheaper and cheap stocks tend to get more expensive. In other words, valuations tend to revert to a mean, right?
이로 인해 많은 사람들은 비싼 주식은 싸지는 경향이 있고 싼 주식은 비싸지는 경향이 있다고 가정하게 되었습니다. 즉, 밸류에이션은 평균으로 회귀하는 경향이 있다는 것이죠. 맞나요?
“We cannot emphasize enough that valuation metrics are NOT historically mean-reverting,” Goldman Sachs analysts wrote in January. They’ve characterized it as “an oft-repeated myth.”
골드만삭스 분석가들은 1월에 “밸류에이션 지표가 역사적으로 평균 회귀하지 않는다는 점을 아무리 강조해도 지나치지 않다”고 썼습니다. 그들은 이를 “자주 반복되는 미신”으로 규정했습니다.
The firm has advanced this controversial view since 2013 (and again in 2022 and 2025). To make their point, they used a Dickey-Fuller test, a tool statisticians use to analyze time-series data. The test found that P/E ratios lacked stationarity, which means the averages aren’t stable over time.
이 회사는 2013년 이후부터 (그리고 2022년과 2025년에도 다시) 이 논란의 여지가 있는 견해를 펼쳐왔습니다. 그들은 주장을 뒷받침하기 위해 통계학자들이 시계열 데이터를 분석하는 데 사용하는 도구인 디키-풀러 검정(Dickey-Fuller test)을 사용했습니다. 검정 결과 P/E 비율은 정상성이 부족한 것으로 나타났는데, 이는 시간이 지남에 따라 평균이 안정적이지 않다는 것을 의미합니다.
This conclusion aligns with arguments from some top Wall Street strategists in recent years. They’ve argued that persistent improvements in business performance and capital structures have justified the higher valuations we’ve seen lately, an idea supported by theory.
이 결론은 최근 몇 년간 월스트리트의 일부 최고 전략가들의 주장과 맥을 같이합니다. 그들은 기업 실적과 자본 구조의 지속적인 개선이 최근 목격된 더 높은 밸류에이션을 정당화했으며, 이는 이론적으로 뒷받침되는 아이디어라고 주장해 왔습니다.
And so, the mean itself is moving.
따라서 평균 그 자체도 이동하고 있습니다.
The idea that valuations aren’t mean-reverting probably makes a lot of people uncomfortable. Then again, trading based on the assumption of mean reversion hasn’t exactly yielded consistent results for people.
밸류에이션이 평균 회귀하지 않는다는 생각은 많은 사람들을 불편하게 만들 것입니다. 하지만 평균 회귀라는 가정에 기반한 거래가 사람들에게 일관된 결과를 안겨준 것도 아닙니다.
Read more about this here and here.
3. Picking a market-beating stock is like calling a coin flip 🪙
One of the main reasons to buy the stock of a single company is that you believe the price will outperform the market average over some period of time. Otherwise, you’d just put that money into an index fund tracking the market average.
단일 기업의 주식을 매수하는 주된 이유 중 하나는 그 주식이 일정 기간 동안 시장 평균을 상회하는 성과를 낼 것이라고 믿기 때문입니다. 그렇지 않다면 그 돈을 그냥 시장 평균을 추종하는 인덱스 펀드에 넣을 것입니다.
A lot of people try their hand at stock picking. But most fail to beat the market.
많은 사람들이 개별 주식 선택에 도전합니다. 하지만 대부분은 시장을 이기는 데 실패합니다.
Why? Because most stocks lag the market. And it’s far more than half.
왜 그럴까요? 대부분의 주식이 시장 수익률에 미치지 못하기 때문입니다. 그리고 그 비율은 절반을 훨씬 넘습니다.
In a study published last year, S&P Dow Jones Indices analysts found that just 19% of S&P 500 companies outperformed the average stock’s return from 2001 to 2025. Most S&P stocks underperformed the index in 13 of the past 24 calendar years.
S&P 다우존스 인덱스 분석가들이 작년에 발표한 연구에 따르면, 2001년부터 2025년까지 S&P 500 기업 중 평균 주식 수익률을 상회한 곳은 단 19%에 불과했습니다. 대부분의 S&P 주식들은 지난 24년의 연도 중 13년 동안 지수를 밑돌았습니다.
Even with stock correlations very low and dispersion high — conditions that theoretically favor those looking to beat the market — professional stock pickers have struggled to identify winners!
주식 간 상관관계가 매우 낮고 분산이 높은 상태—이론적으로 시장을 이기려는 사람들에게 유리한 조건—에서도 전문 주식 선별가들은 승자를 식별하는 데 애를 먹었습니다!
The truth is that market averages, which have trended higher over the years, are driven by a relatively small number of stocks that generate eye-popping returns. ASU Professor Hendrik Bessembinder has published several studies showing this. Even Warren Buffett has attributed Berkshire Hathaway’s outstanding equity portfolio performance to “a few winners.”
진실은, 수년에 걸쳐 상승세를 보여온 시장 평균은 눈이 휘둥그레질 만한 수익을 창출하는 상대적으로 소수의 주식들에 의해 이끌린다는 것입니다. 애리조나주립대(ASU)의 헨드릭 베셈빈더 교수는 이를 보여주는 여러 연구를 발표했습니다. 워런 버핏조차도 버크셔 해서웨이의 뛰어난 주식 포트폴리오 성과를 “소수의 승자들” 덕분이라고 돌렸습니다.
Read more about this here.
4. Holding a market-beating stock is a fun experience 🧺
Let’s say you got lucky and managed to buy one of these few stocks that go on to smoke the rest of the market. Buckle up.
여러분이 운 좋게도 나머지 시장을 압도하는 소수의 주식 중 하나를 매수하는 데 성공했다고 가정해 봅시다. 안전벨트를 단단히 매세요.
In a report published last year, Morgan Stanley’s Michael Mauboussin and Dan Callahan studied the price behavior of 6,500 stocks. They took a closer look at the 20 stocks with the best total shareholder returns over the 40 years from 1985 to 2024.
모건스탠리의 마이클 모부신과 댄 캘러핸은 작년에 발표한 보고서에서 6,500개 주식의 가격 행태를 연구했습니다. 그들은 1985년부터 2024년까지 40년 동안 주주 총수익률이 가장 높았던 20개 주식을 면밀히 살펴보았습니다.
“The median maximum drawdown was 72% for the best group, and the median maximum drawdown duration, the time from peak to trough, was 2.9 years,” they found. “The median time to return to the prior peak was 4.3 years.”
연구 결과, “최고 성과 그룹의 중앙값 기준 최대 낙폭은 72%였으며, 고점에서 저점까지 걸리는 기간인 최대 낙폭 지속 기간의 중앙값은 2.9년이었다”고 합니다. 또한 “이전 고점을 회복하는 데 걸린 시간의 중앙값은 4.3년이었다”고 합니다.
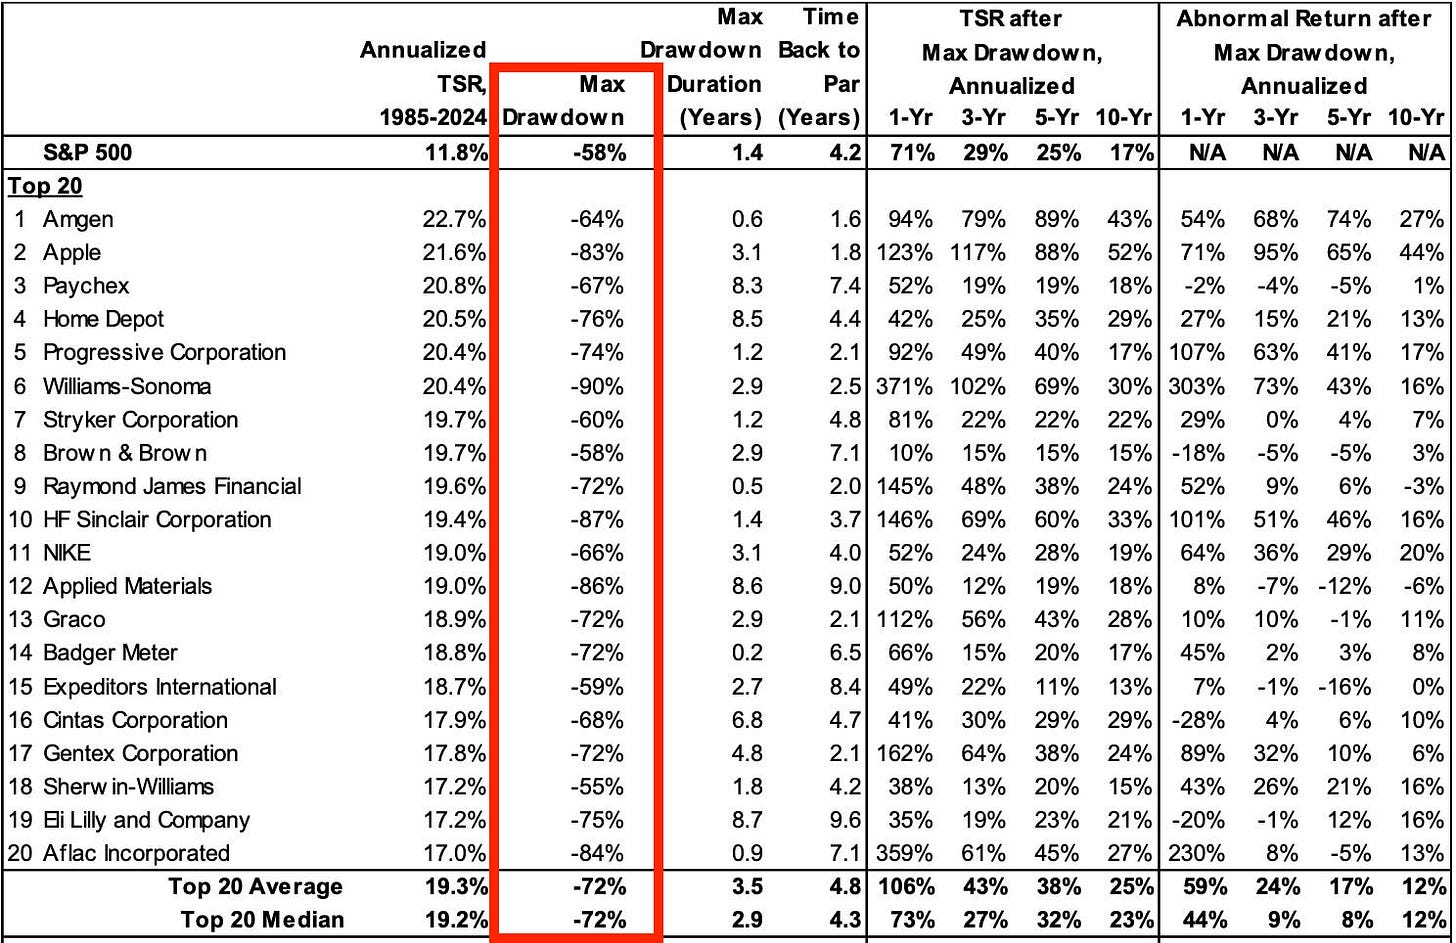
Just thinking about one of my positions losing 72% of its value makes me queasy, even knowing full well this is the average behavior of the best stocks.
최고 주식들의 평균적인 행태라는 것을 잘 알면서도, 내 보유 주식 중 하나가 가치의 72%를 잃는다고 생각만 해도 속이 메스꺼워집니다.
If you’re a fund manager with picks like this, you may be fired long before you’ve been proven right.
이런 종목들을 고른 펀드 매니저라면, 자신의 생각이 옳다는 것이 증명되기도 훨씬 전에 해고될 수도 있습니다.
Read more about this here.
5. The stock market often delivers average returns 🗓️
The first thing many of us are taught about the stock market is that the average annual return is about 8% to 10%, give or take a point or two.
우리 중 많은 사람들이 주식 시장에 대해 가장 먼저 배우는 것은 연평균 수익률이 대략 8%에서 10% 정도라는 점입니다 (1~2% 포인트 정도의 차이는 있겠지만요).
That gives many people the impression that the market climbs 8% to 10%-ish somewhat frequently.
이는 많은 사람들에게 시장이 꽤 자주 8%에서 10% 안팎으로 상승한다는 인상을 줍니다.
But that’s far from the truth.
하지만 그건 진실과는 거리가 멉니다.
Carson Group’s Ryan Detrick ran the numbers. Since 1950, the S&P 500 returned 8%-10% in just four years.
카슨 그룹의 라이언 데트릭이 숫자를 분석해 보았습니다. 1950년 이후 S&P 500이 8%~10%의 수익률을 기록한 해는 단 4년에 불과했습니다.
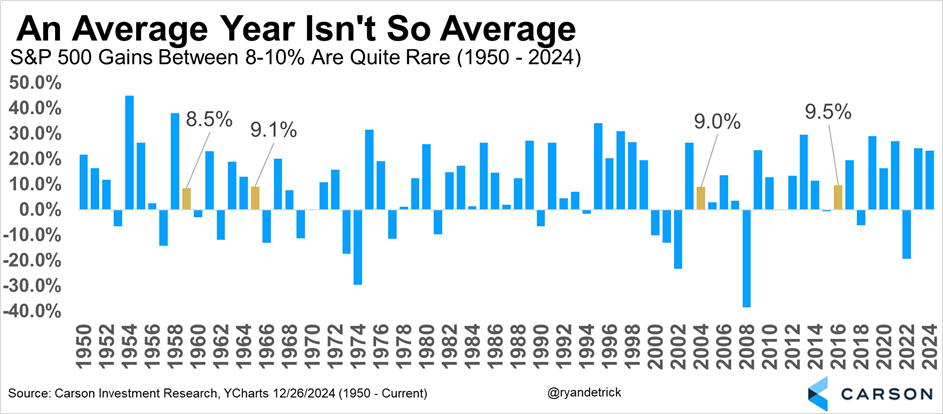
In reality, the long-term average is the result of many above-average years and many below-average years. Ritholtz Wealth Management’s Ben Carlson observed that in the average up-year, the S&P returned 21%. And in the average down-year, the index lost 13%.
실상 장기 평균은 수많은 평균 이상의 해와 수많은 평균 이하의 해들이 합쳐져 만들어진 결과입니다. 리홀츠 웰스 매니지먼트의 벤 카슨은 S&P가 상승세를 기록한 평균적인 해에는 21%의 수익을 냈고, 하락세를 기록한 평균적인 해에는 지수가 13% 하락했다고 지적했습니다.
Read more about this here.
This doesn’t mean you should throw these ideas out the window 🪟
Maybe you’d be ill-advised to try to beat the market by trading on one of these myths or misunderstandings.
이러한 미신이나 오해 중 하나를 바탕으로 거래하여 시장을 이기려고 드는 것은 현명하지 못한 처사일 수 있습니다.
But that doesn’t mean you should ignore them entirely.
하지만 그렇다고 해서 완전히 무시해야 한다는 의미는 아닙니다.
Sometimes, weak returns follow strong returns, valuations move toward the mean, half the stocks you pick beat the market, the outperforming stocks you own never lag, and we get an average year in the market.
때로는 강세 수익률 뒤에 약세가 따르고, 밸류에이션이 평균을 향해 움직이며, 고른 주식의 절반이 시장을 이기고, 보유한 우수 주식들이 한 번도 부진하지 않으며, 시장에서 평범한 한 해를 맞이하기도 합니다.
In other words, sometimes we do get those brief moments when the market behaves as our gut expects.
즉, 때로는 시장이 우리의 직관이 기대하는 대로 움직이는 찰나의 순간들이 실제로 찾아오기도 합니다.
Just because the markets can be chaotic and unpredictable doesn’t mean they never make sense. It’s just that they don’t make sense on a predictable schedule.
시장이 혼란스럽고 예측 불가능하다고 해서 그것이 전혀 이해되지 않는다는 뜻은 아닙니다. 단지 그들이 예측 가능한 일정에 맞춰 이치에 맞게 움직이지 않을 뿐입니다.
-
Related from TKer:
- Mean reversion in the stock market is an ‘optical illusion’ 😵💫
- Goldman: ‘Valuation metrics are NOT historically mean reverting’ 🤯
- How an explosive salesman’s old equation helps explain why stock market valuations are high 🧮
- Warren Buffett: ‘It takes just a few winners to work wonders’ 🏆
- Identifying winning stocks is hard. Holding winning stocks is a nightmare. 🫠
- Why I sometimes tell myself average returns are a mirage 🤨
- 10 truths about the stock market 📈
Review of the macro crosscurrents 🔀
📉The stock market fell last week, with the S&P 500 shedding 0.5% to end at 7,623.68. The index is now down 2.5% from its October 6 closing high of 7,818.93 and up 11.4% year-to-date. For market insights, check out the Stock Market tab at TKer. »
📉 지난주 주식시장은 하락세를 보였으며, S&P 500 지수는 0.5% 하락한 7,623.68로 마감했습니다. 이 지수는 10월 6일의 종가 기준 고점인 7,818.93에 비해 2.5% 하락했으며, 연초 대비로는 11.4% 상승한 상태입니다. 시장에 대한 통찰을 얻으려면 TKer의 주식 시장(Stock Market) 탭을 확인해 보세요. »
There were several notable data points and macroeconomic developments since our last review:
지난 리뷰 이후 주목할 만한 몇 가지 데이터 포인트와 거시경제적 발전 사항은 다음과 같습니다.
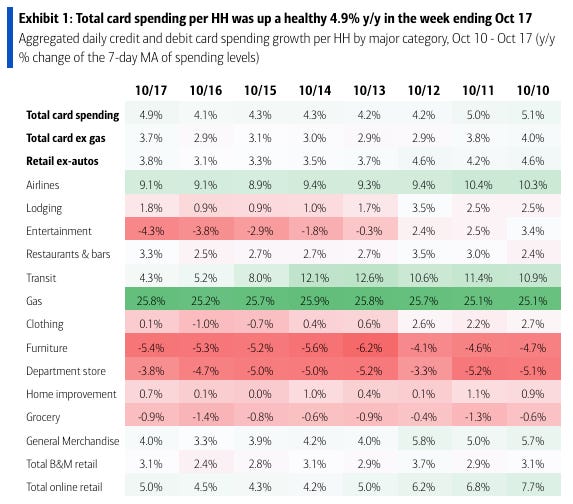
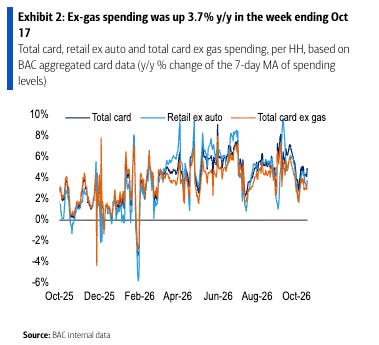
💳 Card spending data is holding up. From BofA: “Total card spending per HH was up 4.9% y/y in the week ending Oct 17, according to BAC aggregated credit & debit card data. Relative to last week, y/y department store spending growth improved the most while entertainment saw the largest decline. Lower-income spending growth has consistently outpaced higher-income spending growth over the past several weeks.”
💳 카드 지출 데이터는 견조한 흐름을 유지하고 있습니다. 뱅크오브아메리카(BofA)에 따르면: “BAC의 신용카드 및 직불카드 집계 데이터에 따르면, 10월 17로 끝나는 주에 가구당 총 카드 지출은 전년 동기 대비 4.9% 증가했습니다. 전주와 비교했을 때, 전년 동기 대비 백화점 지출 증가율이 가장 많이 개선된 반면, 엔터테인먼트 부문은 가장 큰 폭의 하락을 기록했습니다. 저소득층의 지출 증가율은 지난 몇 주 동안 꾸준히 고소득층의 지출 증가율을 상회했습니다."
Consumer spending data has looked a lot better than consumer sentiment readings. For more on this contradiction, read: We’re taking that vacation whether we like it or not 🛫 and Household finances are both ‘worse’ and ‘good’ 🌦️
소비자 지출 데이터는 소비자 심리 지표보다 훨씬 더 양호한 모습을 보여왔습니다. 이러한 모순에 대해 더 알아보려면 다음 글을 읽어보세요: 원하든 원치 않든 우리는 휴가를 떠납니다 🛫 및 가계 재정은 ‘악화’되었기도 하고 ‘좋다’기도 합니다 🌦️
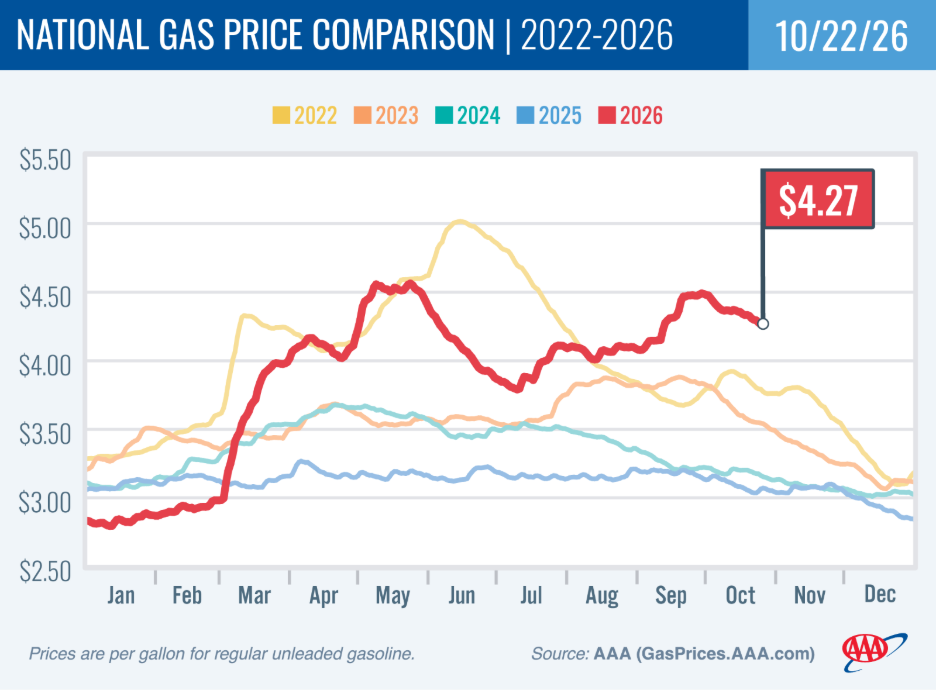
⛽️ Gas prices tick lower, but remain high. From AAA: “The national average for a gallon of regular gasoline fell 6 cents in the last week to $4.27. The drop is fueled by the transition to winter-blend gasoline which is cheaper to produce and costs less for consumers. But high crude oil prices are preventing steep declines at the pump. Currently, the price for a barrel of crude oil is nearing $100 per barrel amid instability in the Strait of Hormuz. This month is poised to set a record as the most expensive October ever for gas prices following similar records set in August and September of this year.”
⛽️ 휘발유 가격은 소폭 하락했으나 여전히 높은 수준을 유지하고 있습니다. 전미자동차협회(AAA)에 따르면: “일반 휘발유 1갤런당 전국 평균 가격은 지난주 6센트 하락한 $4.27를 기록했습니다. 이번 하락은 생산 비용이 저렴하고 소비자에게 비용 부담이 적은 겨울용 휘발유 블렌드로의 전환에 기인합니다. 그러나 높은 원유 가격이 주유소에서의 가파른 가격 하락을 막고 있습니다. 현재 호르무즈 해협의 불안 속에서 원유 1배럴당 가격은 $100에 육박하고 있습니다. 이번 달은 올해 8월과 9월에 기록된 유사한 기록들에 이어, 휘발유 가격 역사상 가장 비용이 많이 드는 10월로 기록될 태세입니다.”
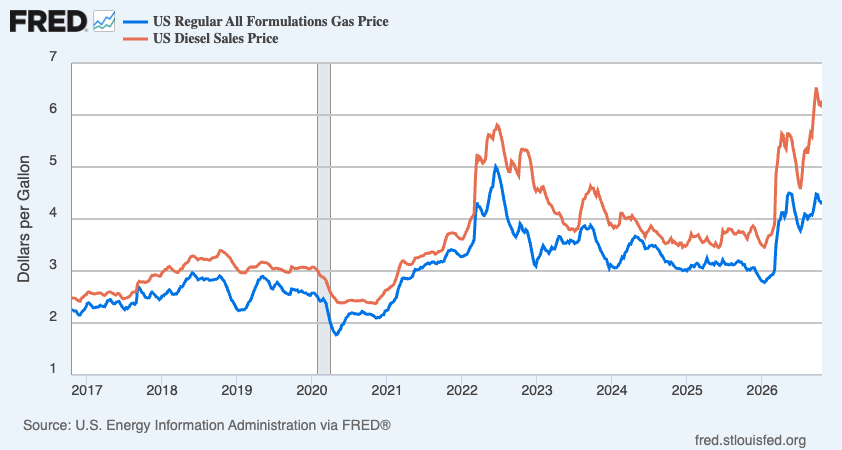
Here’s a longer-term look at gas and diesel price trends, as tracked by the EIA.
에너지 정보청(EIA)이 추적한 휘발유 및 경유 가격 동향의 장기적인 모습은 다음과 같습니다.
For more on energy prices, read: Our love-hate relationship with rising oil prices in charts 💔🛢️📊
에너지 가격에 대해 더 알아보려면 다음 글을 읽어보세요: 차트로 보는 상승하는 유가와의 애증 관계 💔🛢️📊
👎 Consumer vibes are in the dumps. From the University of Michigan’s October Surveys of Consumers: “While year-ahead business conditions improved about 14%, they stand 16% less than last October’s read. This month’s decline in the Current Conditions subindex was driven entirely by buying conditions for durables, which plunged 18% on the basis of higher interest rates and rising concerns about the affordability of such purchases. Purchasing power continues to dominate consumer views of the economy. Sentiment is now 10% below a year ago and 15% less than February, just prior to the Iran conflict.”
👎 소비자 체감 경기는 바닥입니다. 미시간대학교의 10월 소비자 조사(Surveys of Consumers)에 따르면: “향후 1년 간의 경기 여건은 약 14% 개선되었으나, 작년 10월 수치보다는 여전히 16% 낮은 수준입니다. 이번 달 현재 여건 하위 지수(Current Conditions subindex)의 하락은 전적으로 내구재 구입 여건에 의해 주도되었으며, 이는 더 높은 금리와 그러한 구매의 경제성에 대한 우려 증가로 인해 18% 급락했습니다. 구매력이 계속해서 경제에 대한 소비자들의 시각을 지배하고 있습니다. 소비자 심리는 이제 1년 전보다 10% 낮고, 이란 분쟁 직전인 2월보다는 15% 낮습니다.”
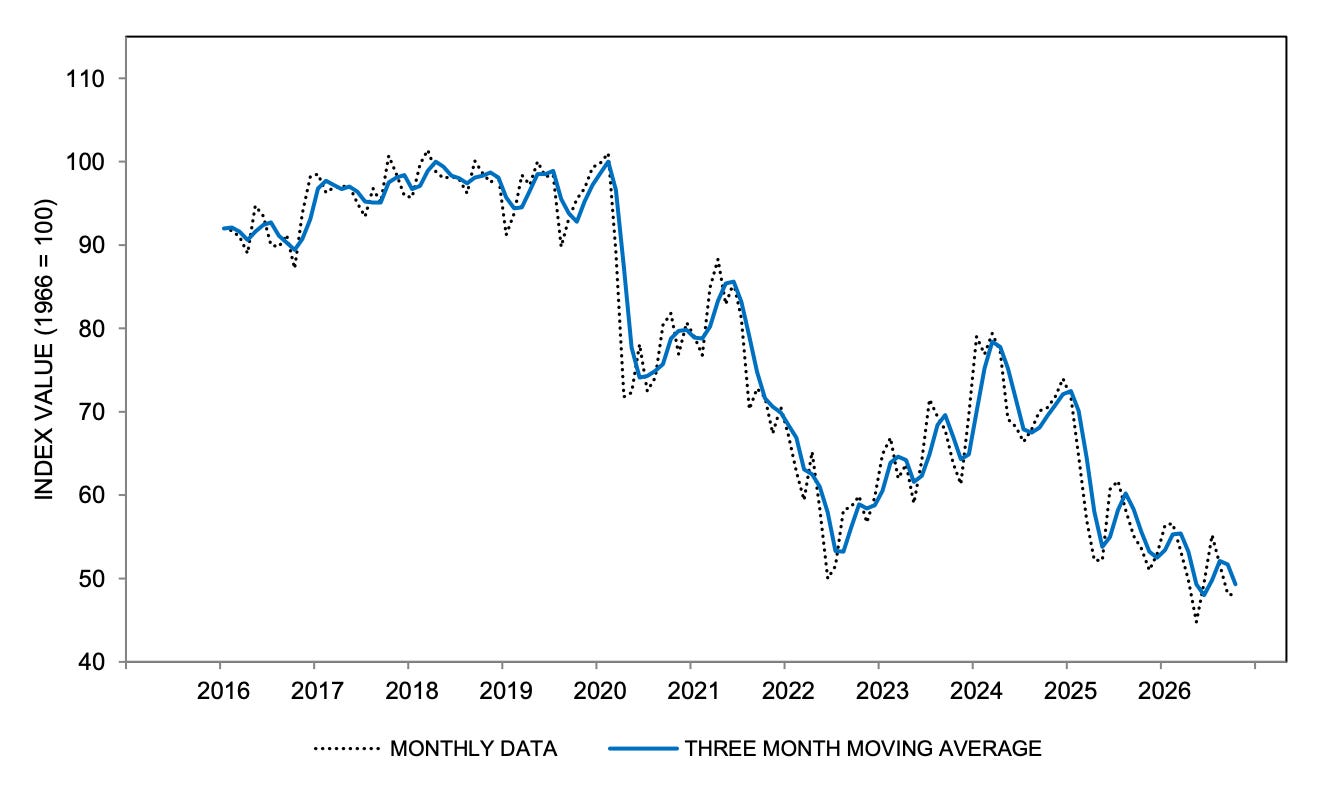
For more on consumer sentiment, read: What consumers do > what consumers say 🙊
소비자 심리에 대해 더 알아보려면 다음 글을 읽어보세요: 소비자가 하는 일 > 소비자가 하는 말 🙊
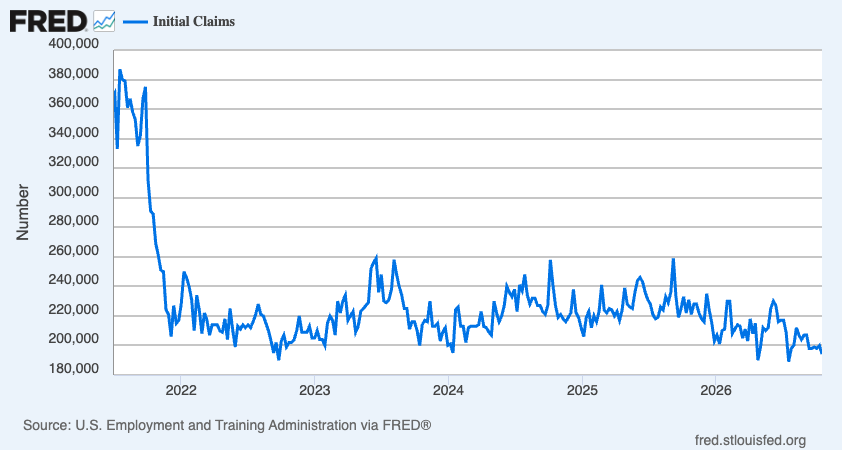
💼 New unemployment insurance claims, total ongoing claims remain low. Initial claims for unemployment benefits ticked down to 194,000 during the week ending Oct. 17, down from 200,000 the week prior. This metric remains at levels historically associated with economic growth.
💼 신규 실업보험 청구 건수와 총 계속 청구 건수는 낮은 수준을 유지하고 있습니다. 10월 17일로 끝나는 주 동안 실업수급 초기 청구 건수는 직전 주의 20만 건에서 19만 4천 건으로 소폭 감소했습니다. 이 지표는 역사적으로 경제 성수기와 연관된 수준을 유지하고 있습니다.
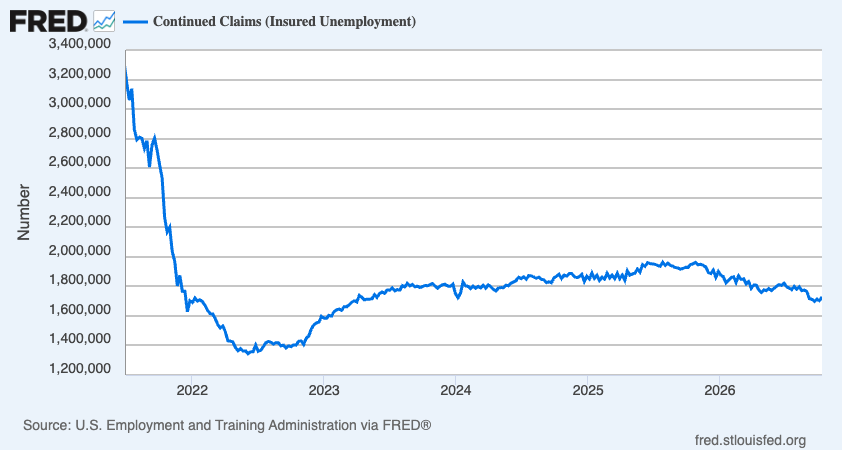
Insured unemployment, which captures those who continue to claim unemployment benefits, ticked up to 1.73 million during the week ending Oct. 10.
실업수급을 계속해서 청구하는 이들을 포착하는 피보험 실업자 수는 10월 10일로 끝나는 주 동안 173만 명으로 소폭 증가했습니다.
For more on the labor market, read: Why mass tech layoffs have little effect on total employment 💾
노동 시장에 대해 더 알아보려면 다음 글을 읽어보세요: 대규모 기술 기업 해고가 전체 고용에 미치는 영향이 미미한 이유 💾
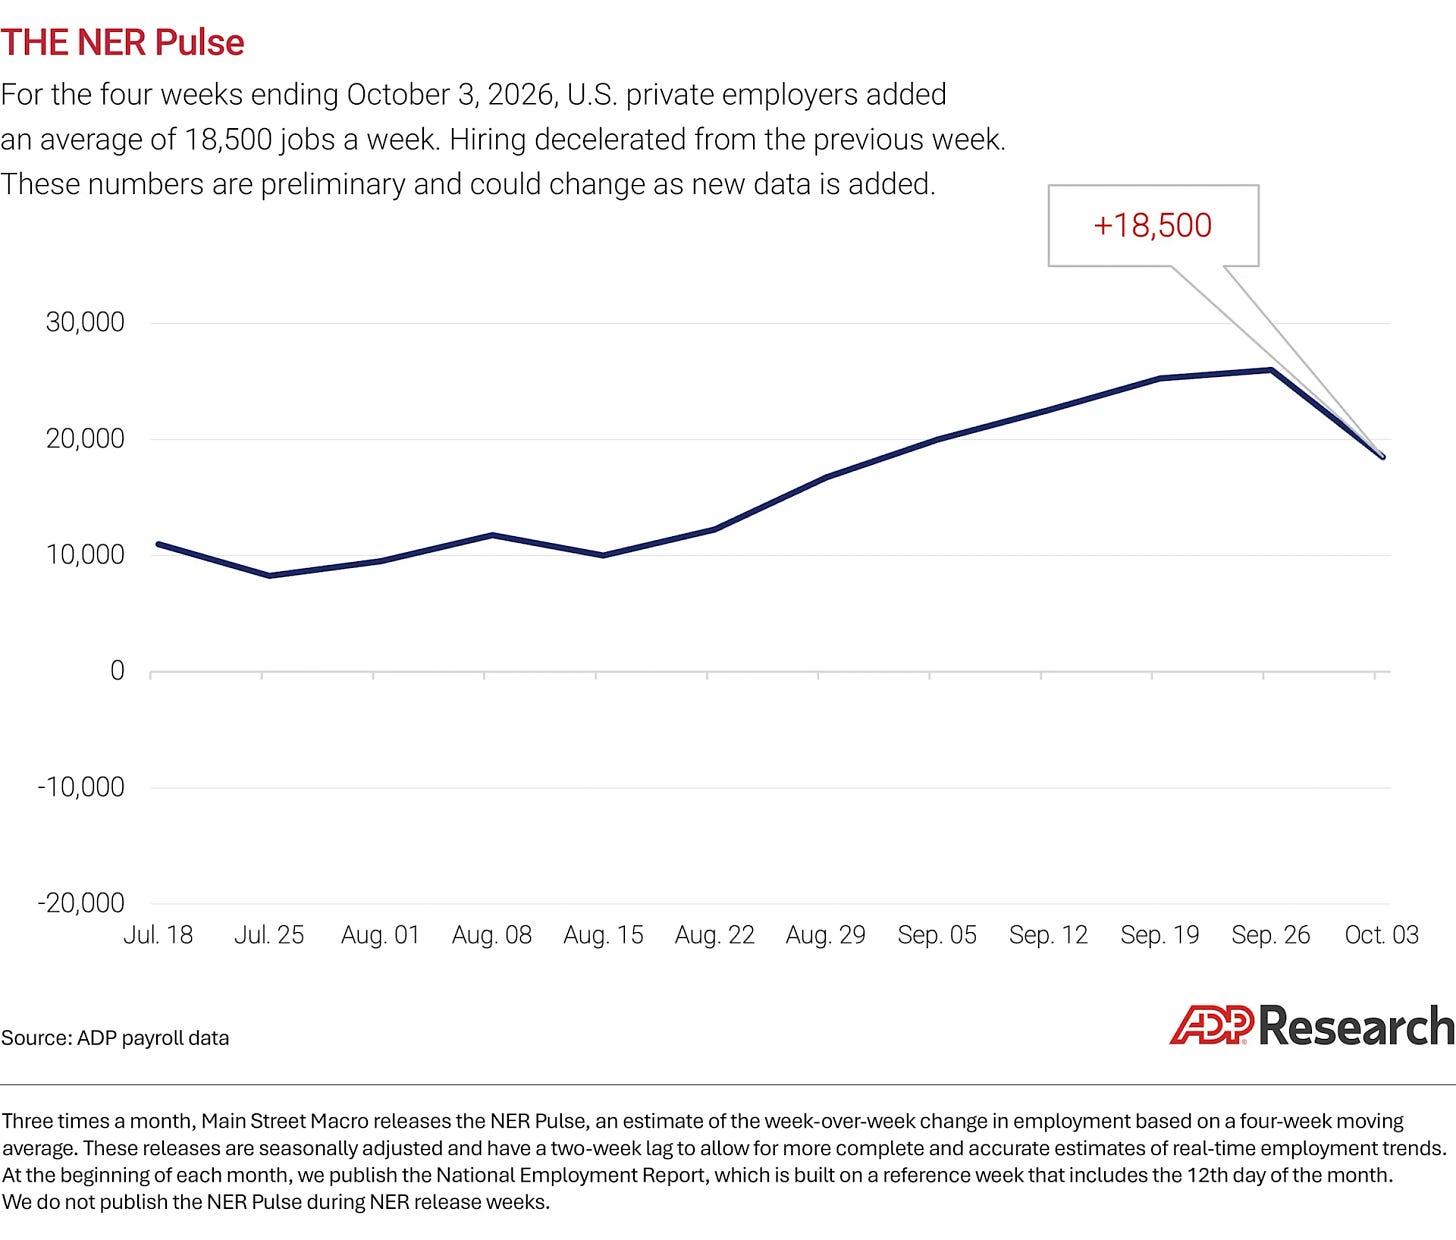
🤔 Recent private job growth is positive. According to payroll processor ADP, private U.S. employers added 18,500 jobs in the four weeks ending Oct. 3.
🤔 최근 민간 부문의 일자리 증가는 긍정적입니다. 급여 처리 업체인 ADP에 따르면, 미국의 민간 고용주들은 10월 3일로 끝나는 4주 동안 18,500개의 일자리를 추가했습니다.
For more on the labor market, read: Things are looking up in the labor market 👍
노동 시장에 대해 더 알아보려면 다음 글을 읽어보세요: 노동 시장이 호조를 보이고 있습니다 👍
🏠 Mortgage rates remain elevated. According to Freddie Mac, the average 30-year fixed-rate mortgage ticked down to 7.32%, down from 7.4% last week. It remains near the highest average rate since Nov. 2023.
🏠 모기지 금리는 여전히 높은 수준을 유지하고 있습니다. 프레디맥(Freddie Mac)에 따르면, 30년 고정 모기지 평균 금리는 지난주 7.4%에서 7.32%로 소폭 하락했습니다. 이는 2023년 11월 이후 가장 높은 평균 금리 수준에 머물러 있습니다.
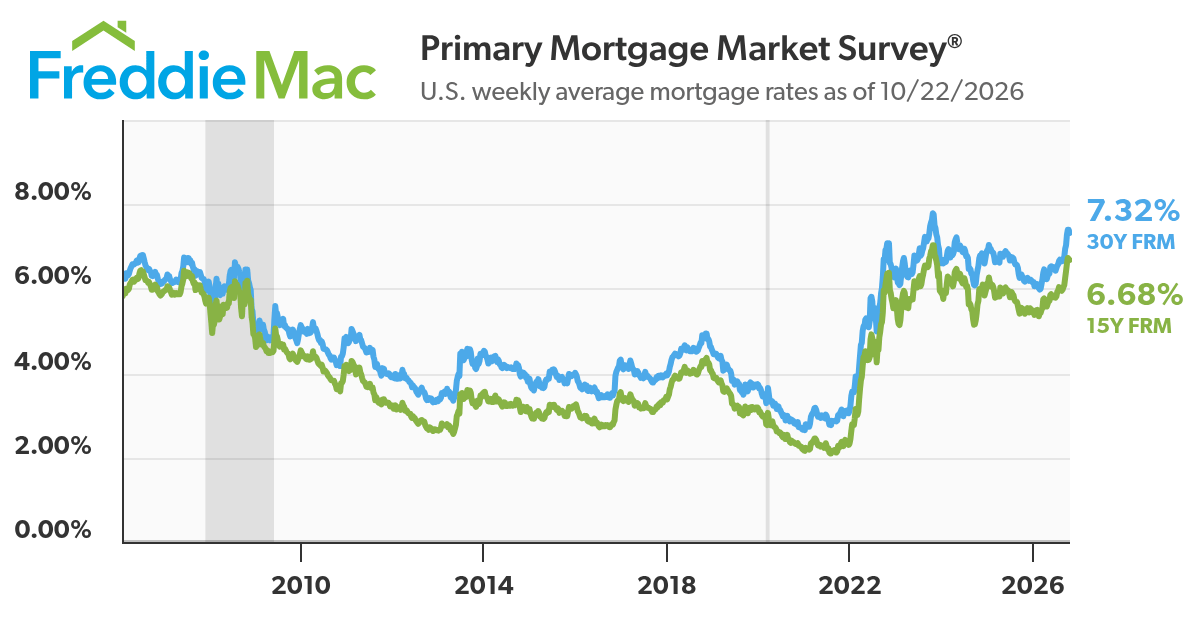
As of Q2, there were 149.5 million housing units in the U.S., of which 87.0 million were owner-occupied and about 40% were mortgage-free. Of those carrying mortgage debt, almost all have fixed-rate mortgages, and most of those mortgages have rates that were locked in before rates surged from 2021 lows. All of this is to say: Most homeowners are not particularly sensitive to the weekly movements in home prices or mortgage rates.
2분기 기준 미국에는 1억 4,950만 채의 주택이 있으며, 이 중 8,700만 채가 자가 소유였고 약 40%는 모기지 부채가 없는 상태였습니다. 모기지 부채를 안고 있는 주택 중 거의 전부는 고정금리 모기지이며, 이들 모기지 대다수는 2021년 최저치에서 금리가 급등하기 전에 금리가 고정된 주택들입니다. 이 모든 것은 다음을 의미합니다. 대다수의 주택 소유자들은 주택 가격이나 모기지 금리의 주간 변동에 그다지 민감하지 않습니다.
For more on mortgages and home prices, read: Why home prices and rents are creating all sorts of confusion about inflation 😖
모기지 및 주택 가격에 대해 더 알아보려면 다음 글을 읽어보세요: 주택 가격과 임대료가 인플레이션에 관한 온갖 혼란을 야기하는 이유 😖
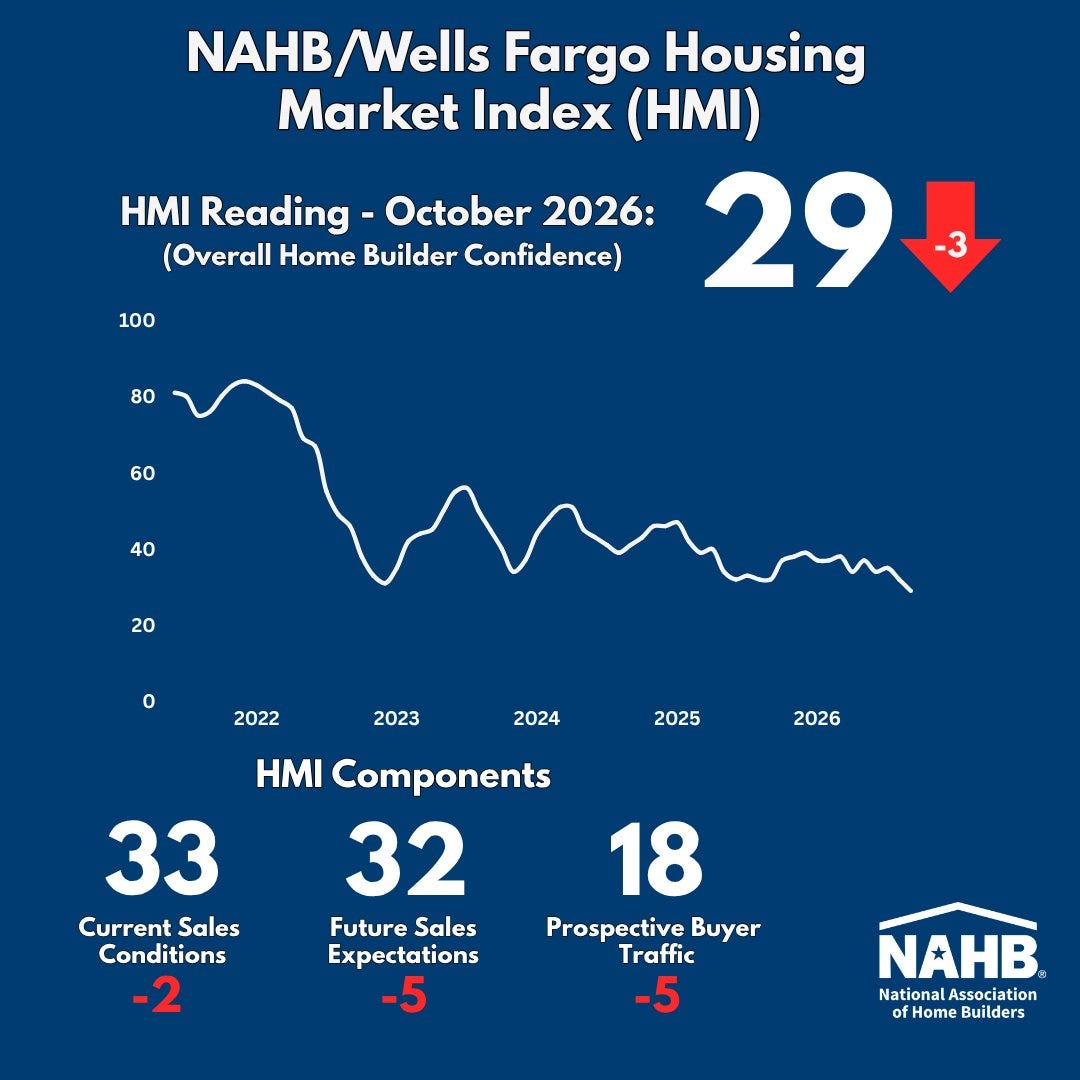
🏠 Homebuilder sentiment falls. From the NAHB: “Housing remains squeezed by supply-side constraints and significant affordability challenges. Demand persists, but higher mortgage rates, elevated construction costs and weaker consumer confidence are keeping more buyers on the sidelines. As a result, buyer traffic has fallen to its lowest level since April 2012, excluding the pandemic’s onset in April 2020.”
🏠 주택건설업자 심리가 하락했습니다. 전미주택건설업협회(NAHB)에 따르면: “주택 부문은 공급 측면의 제약과 상당한 경제성(affordability) 난제로 인해 압박을 받고 있습니다. 수요는 지속되고 있으나, 더 높은 모기지 금리와 상승한 건축 비용, 그리고 약화된 소비자 신뢰가 더 많은 구매자들을 관망세로 머물게 하고 있습니다. 그 결과, 구매자 유입(buyer traffic)은 팬데믹이 시작된 2020년 4월을 제외하면 2012년 4월 이후 최저 수준으로 떨어졌습니다.”
🔨 New home construction starts fell. Housing starts declined 5.2% in September to an annualized rate of 1.22 million units, according to the Census Bureau. Building permits fell 0.2% to an annualized rate of 1.40 million units.
🔨 신규 주택 착공 건수가 감소했습니다. 인구조사국(Census Bureau)에 따르면, 9월 주택 착공 건수는 연환산 기준 5.2% 감소한 122만 채를 기록했습니다. 건축 허가는 0.2% 감소한 연환산 기준 140만 채를 기록했습니다.
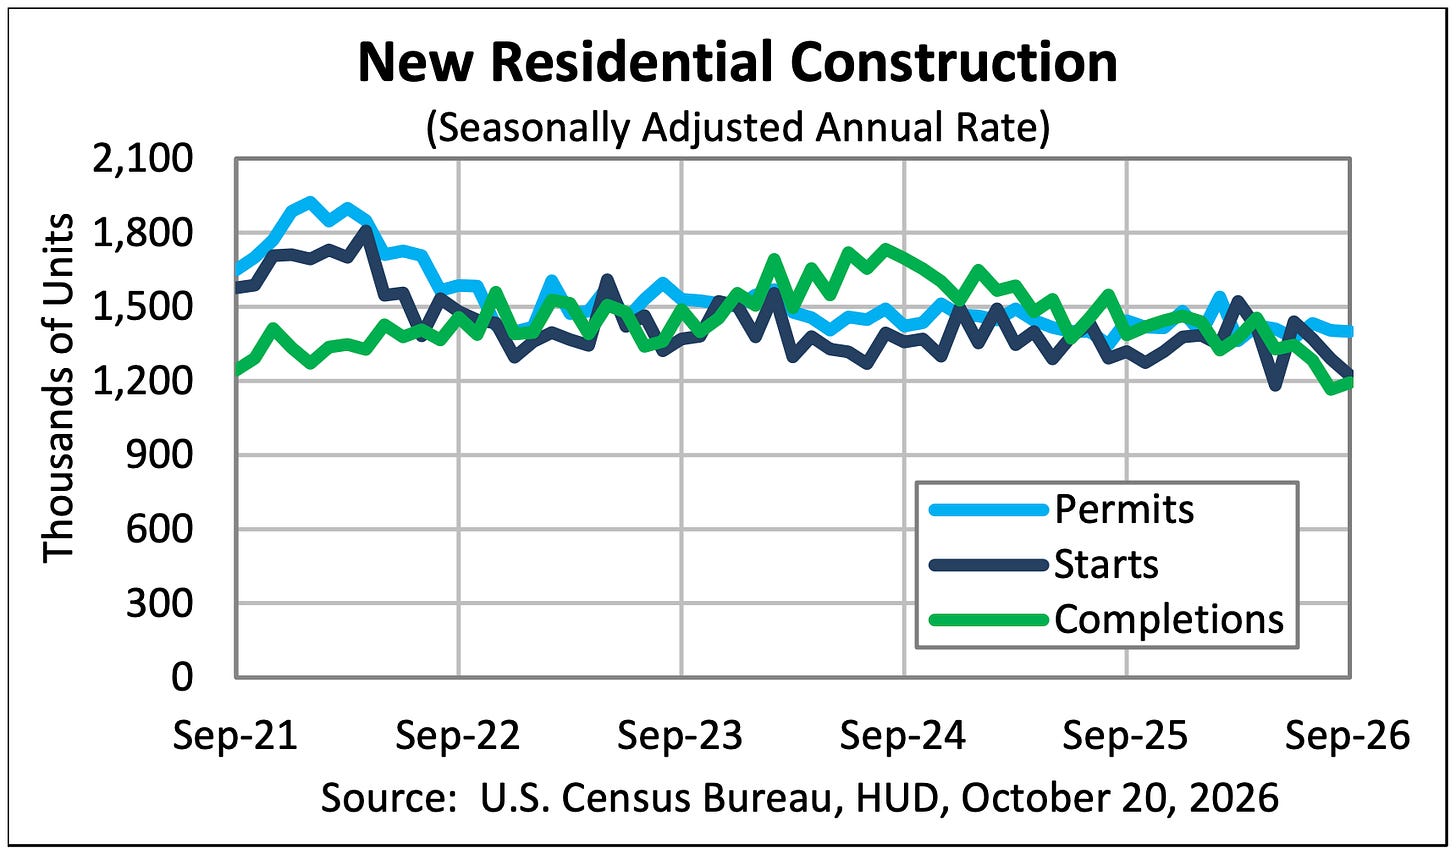
It’s worth noting that the starts metric has a very large margin of error. For more on margins of error, read: Mathematical context can totally change the story 🧮
착공 지표에는 매우 큰 오차 범위가 존재한다는 점을 유념할 가치가 있습니다. 오차 범위에 대해 더 알아보려면 다음 글을 읽어보세요: 수학적 맥락이 이야기를 완전히 바꿀 수 있습니다 🧮
🤔 Economic activity survey signals growth cooled. From S&P Global’s October U.S. Flash PMI: “The output readings from the survey are consistent with GDP growing at a 5% annualized rate after a 4% expansion was signaled for the third quarter. Especially healthy corporate earnings and profits are also indicated, and hiring has surged as companies seek to boost capacity to fulfill stronger customer demand. If the reopening of the economy after COVID is excluded, recent months have seen the best growth spell for US businesses since early 2015. However, cost pressures remain a key concern, notably as the renewed surge in oil prices reverberates through to impact a wide variety of goods and services.”
🤔 경제 활동 조사는 성장세가 둔화되었음을 시사합니다. S&P 글로벌의 10월 미국 예비 PMI(Flash PMI)에 따르면: “조사의 생산 수치는 3분기의 4% 확장에 이어 GDP가 연환산 5% 성장률로 성장하고 있음을 시사합니다. 특히 건실한 기업 실적과 이익도 나타나고 있으며, 기업들이 더 강한 고객 수요를 충족하기 위해 생산 능력을 늘리려 함에 따라 고용이 급증했습니다. 코로나 이후 경제 재개방을 제외하면, 최근 몇 달은 2015년 초 이후 미국 기업들에게 가장 좋은 성장기를 맞이했습니다. 그러나 비용 압박은 여전히 주요 우려 사항으로 남아 있으며, 특히 유가의 재급등이 광범위한 상품과 서비스에 영향을 미치며 파급되고 있습니다.”
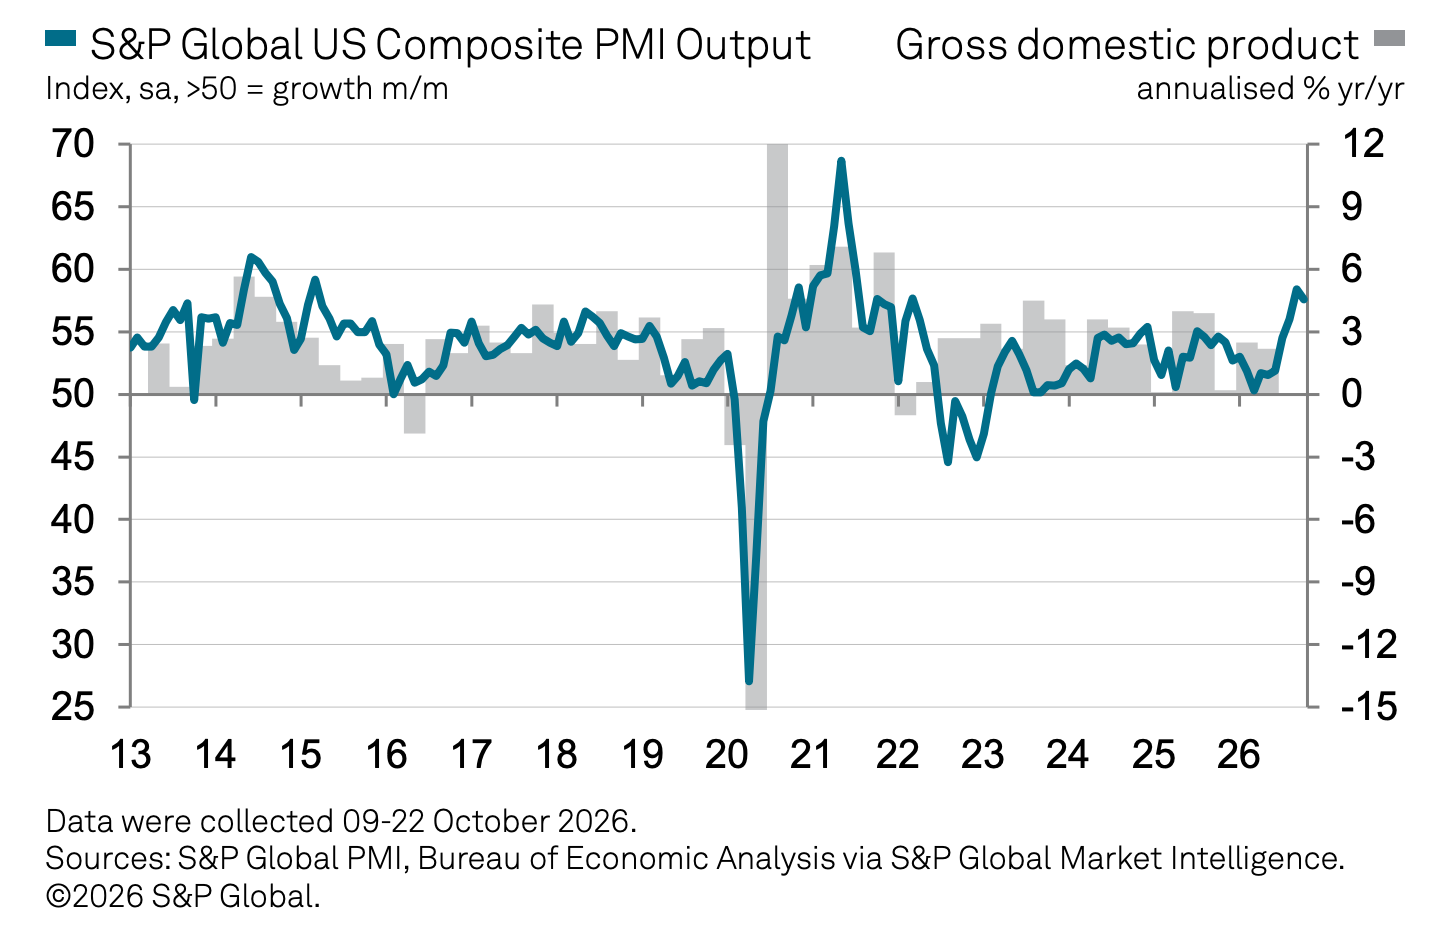
Keep in mind that during times of perceived stress, soft survey data tends to be more exaggerated than actual hard data.
스트레스가 감지되는 시기에는 부드러운(soft) 설문 조사 데이터가 실제 단단한(hard) 데이터보다 더 과장되는 경향이 있다는 점을 명심하십시오.
For more on this, read: What businesses do > what businesses say 🙊 and 4 sometimes-conflicting ways I’m thinking about the economy 😬😞😎🙃
이에 대해 더 알아보려면 다음 글을 읽어보세요: 기업이 하는 일 > 기업이 하는 말 🙊 및 경제를 바라보는 다소 상충되는 4가지 방식 😬😞😎🙃
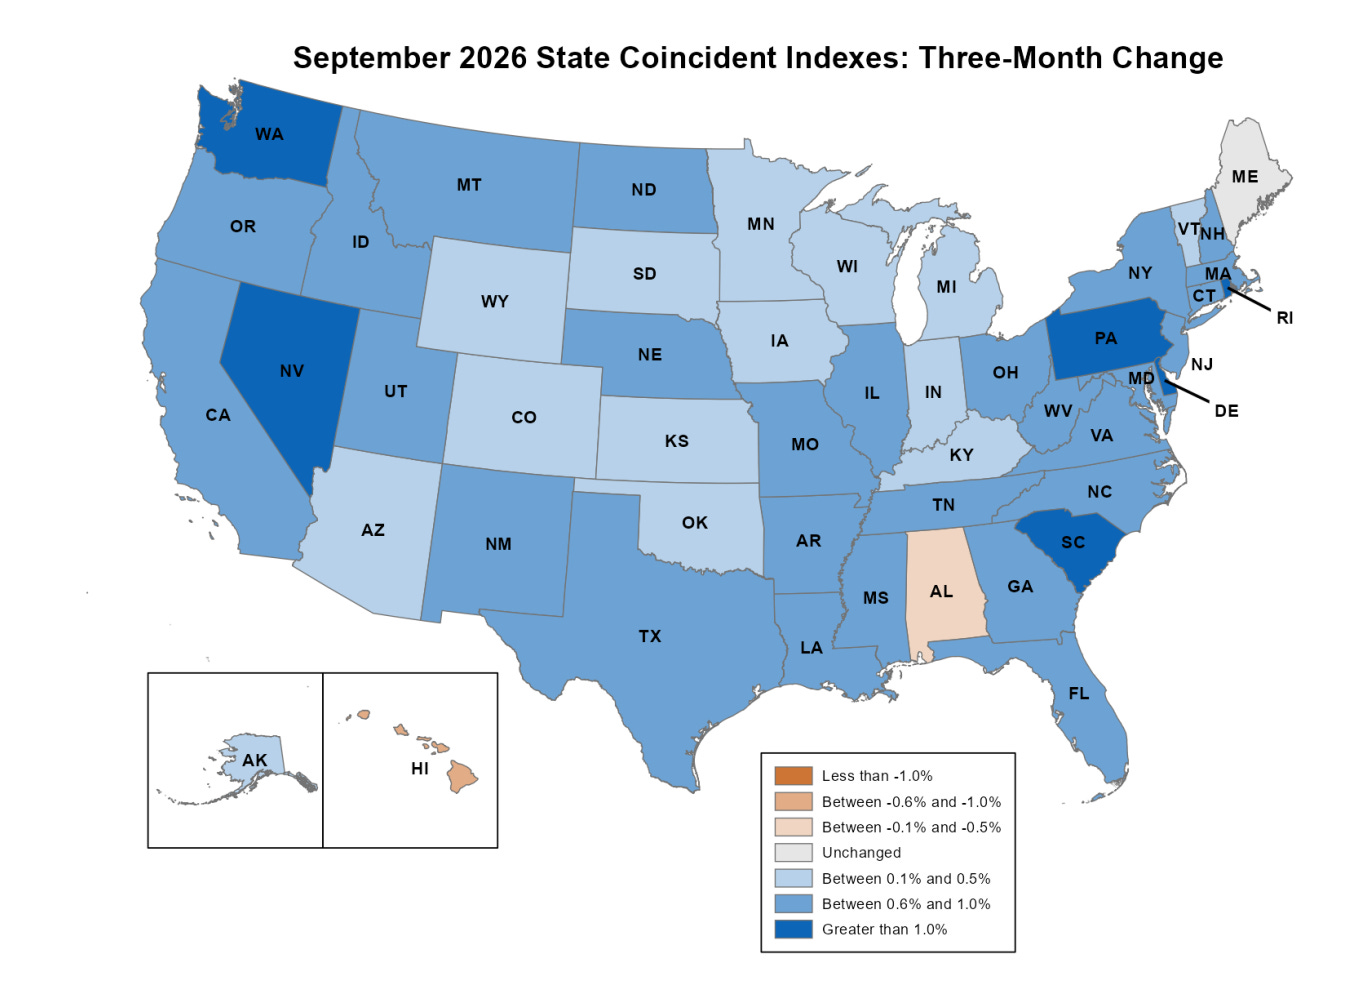
🇺🇸 Most U.S. states are still growing. From the Philly Fed’s September State Coincident Indexes report: “Over the past three months, the indexes increased in 47 states, decreased in two states, and remained stable in one, for a three-month diffusion index of 90. Additionally, in the past month, the indexes increased in 38 states, decreased in seven states, and remained stable in five, for a one-month diffusion index of 62.”
🇺🇸 대부분의 미국 주는 여전히 성장세를 보이고 있습니다. 필라델피아 연은의 9월 주 동행지수(State Coincident Indexes) 보고서에 따르면: “지난 3개월 동안 이 지수는 47개 주에서 상승하고, 2개 주에서 하락했으며, 1개 주에서 안정세를 유지하여 3개월 확산 지수(diffusion index) 90을 기록했습니다. 또한 지난 한 달 동안 이 지수는 38개 주에서 상승하고, 7개 주에서 하락했으며, 5개 주에서 안정세를 유지하여 1개월 확산 지수 62를 기록했습니다.”
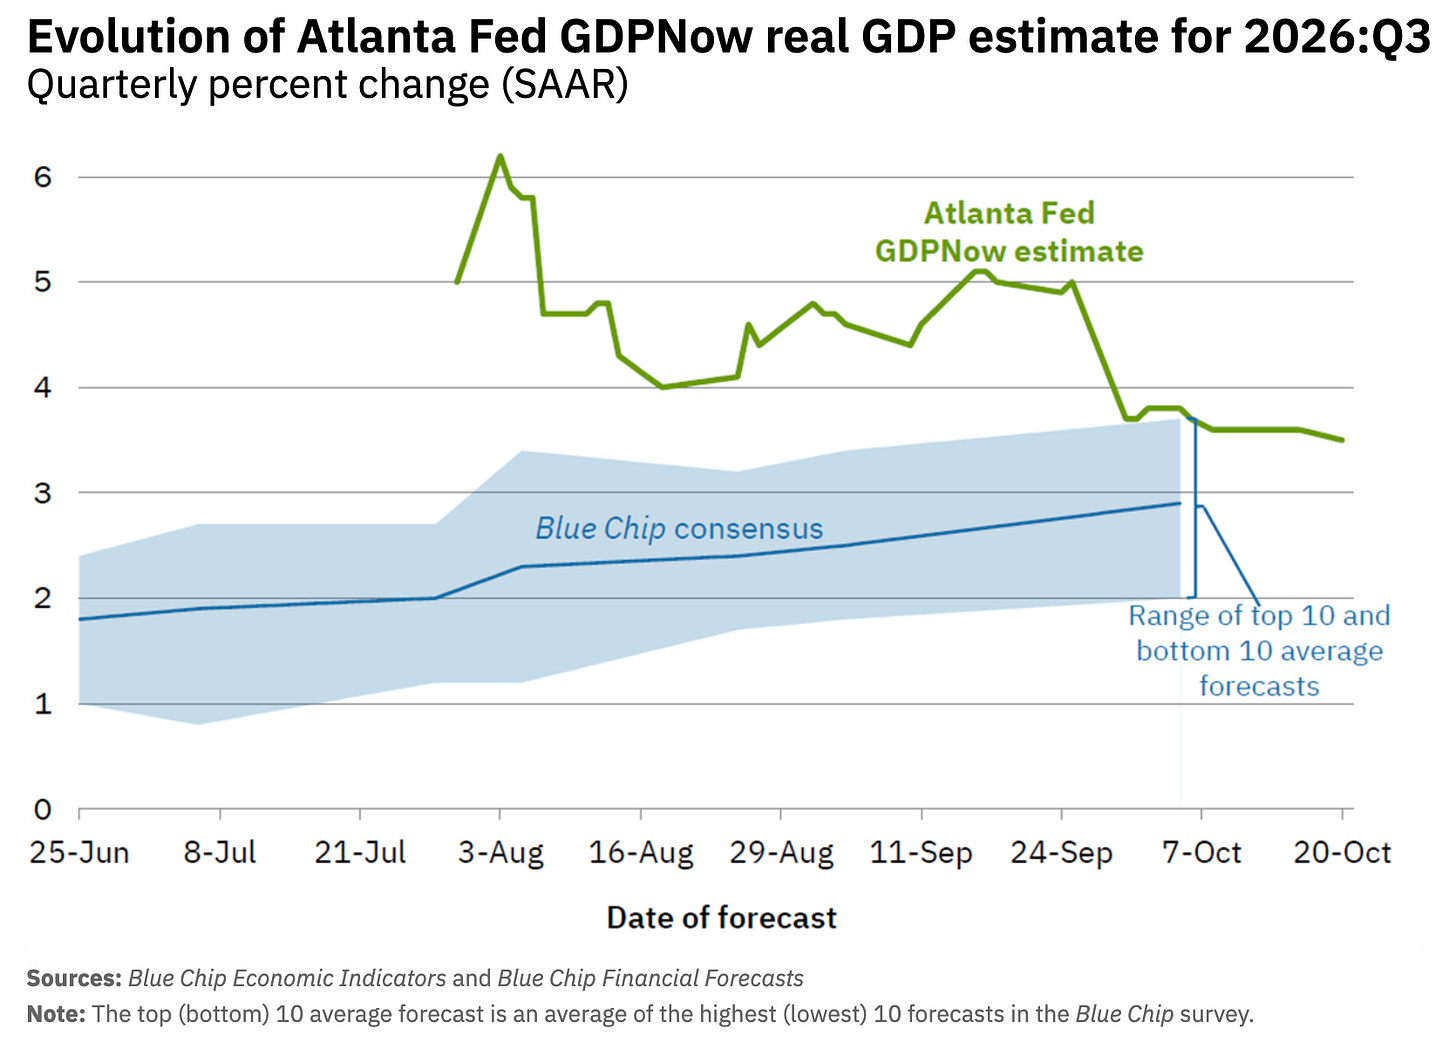
📈 Near-term GDP growth estimates are tracking positively. The Atlanta Fed’s GDPNow model sees real GDP growth rising at a 3.5% rate in Q3.
📈 단기 GDP 성장률 전망치는 긍정적인 방향으로 추적되고 있습니다. 애틀랜타 연은의 GDPNow 모델은 3분기 실질 GDP 성장률이 3.5%의 비율로 상승할 것으로 보고 있습니다.
For more on GDP and the economy, read: It’s too ambiguous to just say ‘the economy’ 🤦🏻♂️ and Economic data can often be both ‘worse’ and ‘good’ 🌦️
GDP와 경제에 대해 더 알아보려면 다음 글을 읽어보세요: 단순히 ‘경제’라고 말하기에는 너무 모호합니다 🤦🏻♂️ 및 경제 데이터는 종종 ‘악화’된 동시에 ‘좋을’ 수 있습니다 🌦️
Putting it all together 📋
Earnings look bullish: The long-term outlook for the stock market remains favorable, bolstered by expectations for years of earnings growth. And earnings are the most important driver of stock prices.
실적은 강세(bullish)를 시사합니다: 수년간의 이익 성장에 대한 기대감에 힘입어 주식 시장의 장기적 전망은 여전히 우호적입니다. 그리고 실적은 주가의 가장 중요한 동력입니다.
Demand is positive: Demand for goods and services remains positive, supported by healthy consumer and business balance sheets. Personal spending activity remains at record levels. Core capex orders, which are a leading indicator of business spending, have been trending higher.
수요는 긍정적입니다: 건실한 가계 및 기업 재무제표의 뒷받침을 받아 상품과 서비스에 대한 수요는 여전히 긍정적입니다. 개인 지출 활동은 기록적인 수준을 유지하고 있습니다. 기업 지출의 선행 지표인 핵심 자본재 수주(Core capex orders)는 상승 추세를 보이고 있습니다.
Growth rates have cooled: While the economy remains healthy, growth has normalized from much hotter levels earlier in the cycle. The economy is less “coiled” these days as major tailwinds like job openings and excess savings have faded. Job creation, while positive, is not as hot as it used to be. It has become harder to argue that growth is destiny.
성장률은 둔화되었습니다: 경제는 여전히 건실하지만, 성장세는 사이클 초기의 훨씬 뜨거웠던 수준에서 정규화되었습니다. 구인 건수와 초과 저축 같은 주요 순풍들이 사라지면서 요즘 경제는 과거처럼 팽팽하게 감겨 있지(coiled) 않습니다. 일자리 창출은 긍정적이기는 하나 예전만큼 뜨겁지 않습니다. 성장이 곧 운명이라고 주장하기는 더 어려워졌습니다.
Actions speak louder than words: We are in an odd period, as hard economic data has decoupled from soft, sentiment-driven data. Consumer and business sentiment has been relatively poor, even as tangible consumer and business activity continues to grow and trend at record levels. From an investor’s perspective, what matters is that the hard economic data holds up.
행동은 말보다 소리가 큽니다: 단단한 경제 데이터가 감정 주도형의 부드러운 데이터와 탈동조화(decouple)되면서 우리는 기묘한 시기를 지나고 있습니다. 가계와 기업의 tangible(실질적인) 소비 및 사업 활동이 계속해서 성장하며 기록적인 수준을 추세적으로 나타내고 있음에도 불구하고, 소비자 및 기업 심리는 상대적으로 저조했습니다. 투자자의 관점에서 중요한 것은 단단한 경제 데이터가 버텨주느냐 하는 것입니다.
Stocks are not the economy: There’s a case to be made that the U.S. stock market could outperform the U.S. economy in the near term, thanks largely to positive operating leverage. Since the pandemic, companies have aggressively adjusted their cost structures. This included strategic layoffs and investment in new equipment, including AI-powered hardware. These moves are driving positive operating leverage, meaning modest sales growth — in the cooling economy — translates into robust earnings growth.
주식은 경제가 아닙니다: 주로 긍정적인 영업 레버리지(operating leverage) 덕분에 미국 주식시장이 단기적으로 미국 경제를 상회하는 성과를 낼 수 있다는 주장이 제기될 수 있습니다. 팬데믹 이후 기업들은 전략적 해고와 AI 기반 하드웨어를 포함한 신규 장비 투자를 포함하여 비용 구조를 공격적으로 조정해 왔습니다. 이러한 조치들은 긍정적인 영업 레버리지를 유도하고 있으며, 이는 냉각되는 경제 속에서도 완만한 매출 성장이 강력한 이익 성장으로 전환됨을 의미합니다.
Mind the ever-present risks: We should not get complacent. There will always be risks to worry about, such as U.S. political uncertainty, geopolitical turmoil, energy price volatility, and cyberattacks. There are also the dreaded unknowns. Any of these risks can flare up and spark short-term market volatility.
항상 존재하는 리스크에 유의하십시오: 안주해서는 안 됩니다. 미국의 정치적 불확실성, 지정학적 혼란, 에너지 가격 변동성, 사이버 공격 등 우려해야 할 리스크는 항상 존재합니다. 두려운 미지의 요인들도 있습니다. 이러한 리스크 중 어느 것이든 불거져 나와 단기적인 시장 변동성을 촉발할 수 있습니다.
Investing is never a smooth ride: Economic recessions and bear markets are harsh realities that all long-term investors should expect as they build wealth in the markets. Always keep your stock market seat belts fastened.
투자는 결코 순탄한 길이 아닙니다: 경기 침체와 약세장은 모든 장기 투자자가 시장에서 부를 쌓아가면서 예상해야 할 가혹한 현실입니다. 항상 주식시장 안전벨트를 단단히 매십시오.
Think long-term: For now, there’s no reason to believe the economy and the markets will face a challenge they can’t overcome. The long game remains undefeated, and long-term investors can expect that streak to continue.
장기적인 안목을 가지십시오: 현재로서는 경제와 시장이 극복할 수 없는 난관에 직면할 것이라고 믿을 만한 이유는 없습니다. 장기 레이스는 패배한 적이 없으며, 장기 투자자들은 그 연승 행진이 계속될 것으로 기대할 수 있습니다.
For more on how the macro story is evolving, check out the previous review of the macro crosscurrents. »
거시경제적 흐름이 어떻게 진화하고 있는지에 대해 더 알아보려면 이전의 거시경제 교차류 리뷰를 확인해 보세요. »