A word of caution about bullish post-midterm election stock market patterns ⚠️
Source: https://www.tker.co/p/stock-market-midterm-election-bullish-pattern
The periods before and after midterm elections are famously volatile for stocks.
중간선거 전후의 시기는 주식 시장에서 유독 변동성이 크기로 유명합니다.
Historically, midterm election years have had an average intra-year drawdown of 18% for the S&P 500. This is worse than the average 14% drawdown across all years.
역사적으로 S&P 500 지수는 중간선거 해에 연중 평균 18%의 고점 대비 저점(drawdown) 하락을 겪었습니다. 이는 모든 연도의 평균 하락 폭인 14%보다 더 나쁜 수치입니다.
On the plus side, the stock market has tended to perform well once there’s a clearer indication of what the election results could look like. As the midterm election gets closer, markets typically react positively, regardless of the party in power.
긍정적인 점은, 선거 결과가 어떻게 나올지에 대해 더 명확한 윤곽이 드러나면 주식 시장이 선전하는 경향이 있다는 것입니다. 중간선거가 다가올수록 시장은 집권 정당과 무관하게 대개 긍정적으로 반응합니다.
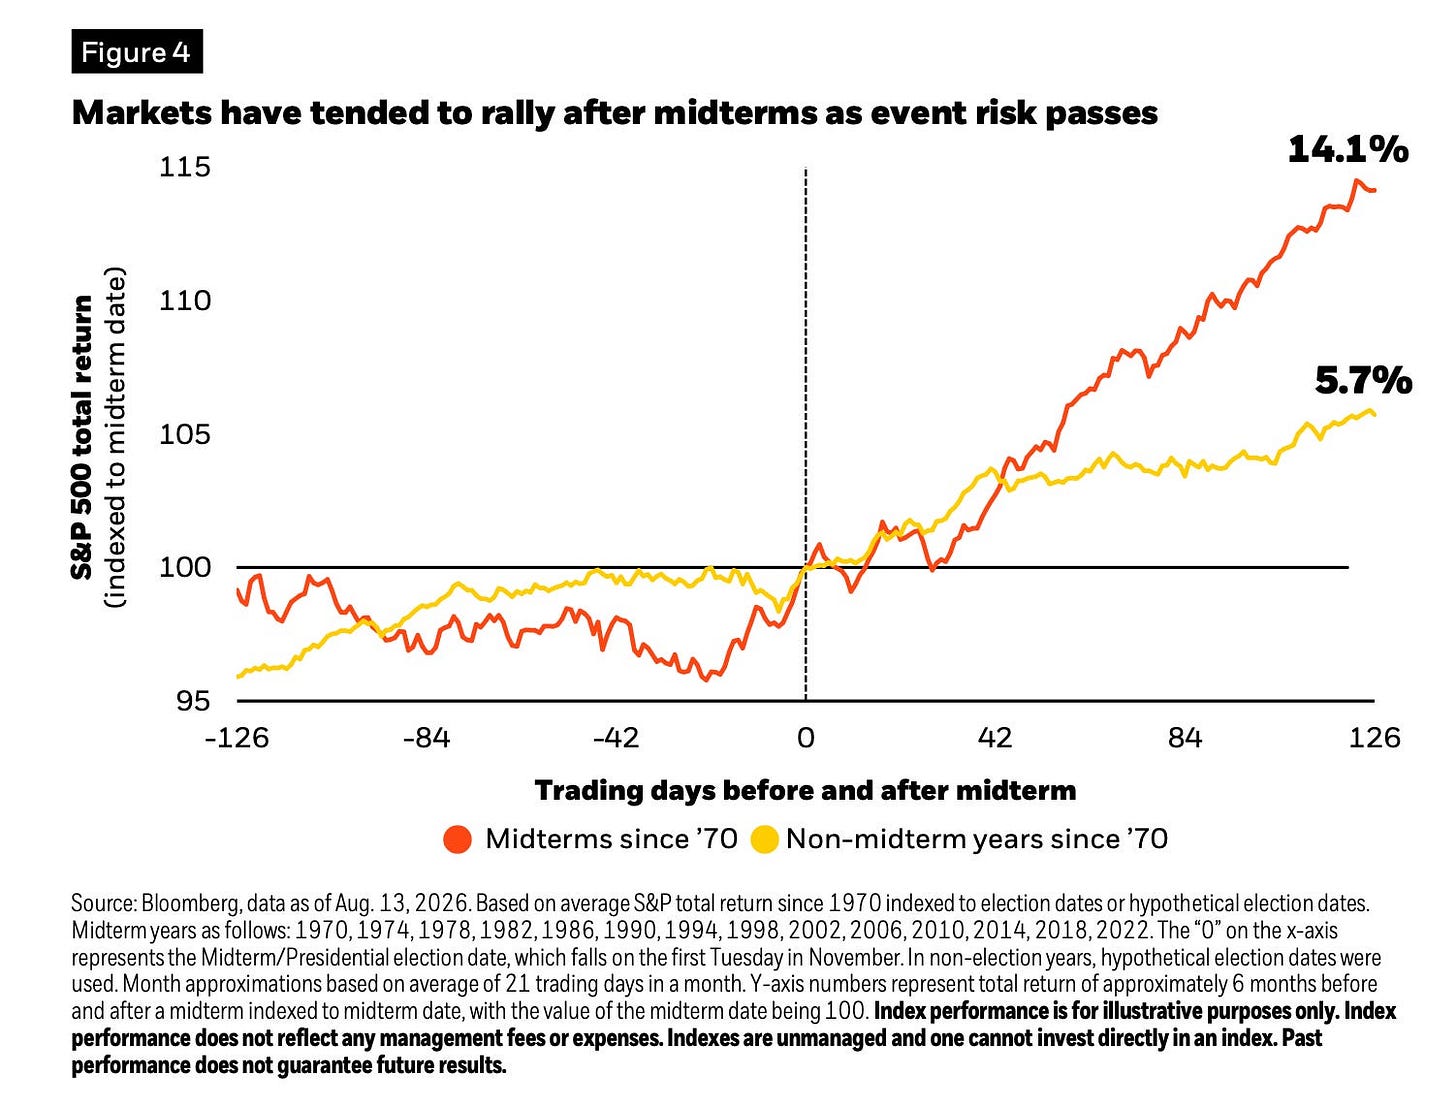
“Since 1970, the market has started to rally on average around a month (22 trading days) before a midterm election, as polling data provides clearer indications of results,” BlackRock analysts wrote earlier this year. “As event risk passes post-election, equities have historically experienced tailwinds, with an average return of 14.1% in the following six months compared to 5.7% in non-midterm years.”
블랙록(BlackRock) 분석가들은 올해 초 보고서에서 “1970년 이후 여론조사 데이터를 통해 선거 결과에 대한 더 명확한 힌트가 제공되면서, 시장은 중간선거 약 한 달(거래일 기준 22일) 전부터 평균적으로 랠리를 시작했다”며, “선거 이후 이벤트 리스크가 지나가면 주식 시장은 순풍을 맞아 중간선거가 없는 해의 평균 수익률(5.7%)과 비교해 향후 6개월 동안 평균 14.1%의 수익률을 기록했다”고 적었습니다.
Other analysts have found similarly compelling data points.
다른 분석가들도 이와 비슷하게 주목할 만한 데이터들을 찾아냈습니다.
Jeffrey Hirsch of Almanac Trader has noted the strongest 6-month period of the 4-year presidential cycle has historically started in November of midterm election years.
알마나크 트레이더(Almanac Trader)의 제프리 허시(Jeffrey Hirsch)는 4년 주기의 대통령 임기 중 가장 강력한 6개월 기간이 역사적으로 중간선거 해의 11월에 시작되었다고 지적했습니다.
Joe Terranova of Virtus Investment Partners found that since 1939, the stock market has produced a positive return from the midterm election date to June 30 of the following year 100% of the time. Of those 21 observations, 14 had double-digit returns.
벌투스 인베스트먼트 파트너스(Virtus Investment Partners)의 조 테라노바(Joe Terranova)는 1939년 이후 주식 시장이 중간선거일부터 다음 해 6월 30일까지 100 확률로 양(+)의 수익률을 기록했다고 밝혔습니다. 그 21번의 관측치 중 14번은 두 자릿수 수익률을 기록했습니다.
There’s a basic explanation for this pattern: Midterm elections can have significant policy implications, and the uncertainty caps prices as everyone waits for clarity on the policy outlook.
이러한 패턴에 대한 기본적인 설명은 다음과 같습니다. 중간선거는 정책에 상당한 파장을 미칠 수 있으며, 모든 이가 정책 전망이 명확해지기를 기다리기 때문에 이러한 불확실성이 주가 상승을 억제한다는 점입니다.
And the elections are an uncertainty-clearing event.
그리고 선거는 불확실성을 해소해 주는 이벤트입니다.
There are cases to be made that certain election results are more bullish for the market than others. But regardless of the outcome, removing uncertainty alone seems enough to boost prices, as businesses move forward with any plans that may have been exposed to upcoming policy decisions.
특정 선거 결과가 시장에 더 호재로 작용한다는 주장을 펼칠 수도 있습니다. 하지만 결과가 어떻게 나오든 간에, 불확실성을 해소한다는 그 사실 자체만으로도 다가올 정책 결정의 영향을 받던 기업들이 계획들을 다시 추진하게 되면서 주가를 끌어올리기에 충분해 보입니다.
A cautionary note ⚠️
All of these historical patterns are consistent with a stock market that experiences intermittent volatility even as it usually goes up.
이러한 역사적 패턴들은 모두 주식 시장이 평소에는 우상향하더라도 간헐적인 변동성을 겪는다는 점과 일맥상통합니다.
But especially in the short run, there’s never a guarantee that what’s been a statistically regular event will repeat next time.
하지만 특히 단기적으로는, 통계적으로 규칙성을 가졌던 이벤트가 이번에도 그대로 반복된다는 보장은 결코 없습니다.
In other words, I’d be reluctant to get too creative with trades based on what history suggests could happen in the next several months.
다시 말해, 앞으로 몇 달 동안 역사적 시그니처대로 흘러갈 것이라는 기대를 바탕으로 너무 창의적인 트레이딩(변칙적인 투자)을 하는 것은 꺼려집니다.
Keep in mind that so far this year, the S&P 500 has experienced a max drawdown of just 9%, which is already a bit inconsistent with the historical averages.
올해 들어 현재까지 S&P 500 지수가 고점 대비 겨우 9% 하락하는 데 그쳤다는 점을 명심하세요. 이는 이미 역사적 평균과는 다소 거리가 있는 모습입니다.
To be clear, I’m not suggesting you reposition your portfolio for one outcome or another. Personally, I don’t expect to stray from my long-term strategy. I almost never do.
분명히 해두자면, 저는 여러분께 어느 한쪽의 결과에 맞춰 포트폴리오를 재조정하라고 제안하는 것이 아닙니다. 개인적으로 저는 저의 장기 투자 전략에서 벗어날 생각이 없습니다. 거의 그러지 않는 편입니다.
Rather, I’m just cautioning against getting too excited about what’s historically been a bullish short-term period for stocks.
오히려 저는, 역사적으로 주식 시장에 강세였던 단기 기간이 찾아온다고 해서 지나치게 들뜨는 것에 대해 경고하려는 것입니다.
-
Related from TKer:
- 2026 could be crappy for the stock market, and that would be normal 📉
- 12 stock market charts that caught my attention 📊
- 27 charts to consider as we look forward in the stock market 📉📈
- 10 truths about the stock market 📈
Review of the macro crosscurrents 🔀
📉The stock market fell last week, with the S&P 500 shedding 0.6% to end at 7,623.68. The index is now down 3.1% from its October 6 closing high of 7,818.93 and up 10.7% year-to-date. For market insights, check out the Stock Market tab at TKer. »
📉 지난주 주식 시장은 하락세를 보였으며, S&P 500 지수는 0.6% 하락한 7,623.68로 마감했습니다. 이 지수는 지난 10월 6일의 종가 고점(7,818.93) 대비 3.1% 하락한 상태이며, 연초 대비로는 10.7% 상승한 상태입니다. 시장 인사이트를 원하시면 TKer의 주식 시장(Stock Market) 탭을 확인해 보세요. »
There were several notable data points and macroeconomic developments since our last review:
지난번 점검 이후 주목할 만한 몇 가지 데이터 포인트와 거시경제적 발전 사항은 다음과 같습니다.
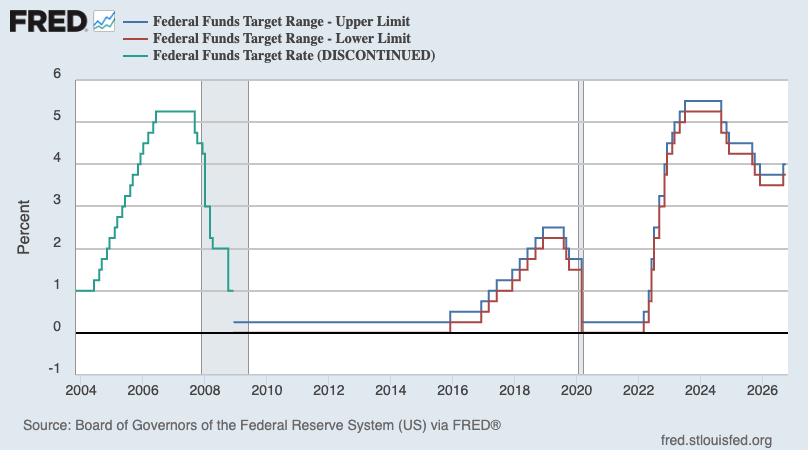
🏛️ Fed holds rates. On Wednesday, the Federal Reserve kept its benchmark interest rate target unchanged at a range of 3.75% to 4.00%. The decision passed 10-2, with Governor Lisa Cook and Cleveland Fed President Beth Hammack dissenting and calling for a rate hike.
🏛️ 연준(Fed), 금리 동결. 수요일, 연방준비제도는 벤치마크 기준금리 목표 범위를 3.75%~4.00%로 유지했습니다. 이번 결정은 10대 2로 통과되었으며, 리사 쿡(Lisa Cook) 연준 이사와 베스 해맥(Beth Hammack) 클리블랜드 연은 총재는 금리 인상을 주장하며 반대 표를 던졌습니다.
From the Fed’s statement: “Economic activity is expanding at a strong pace. While uncertainty remains elevated owing, in part, to geopolitical developments, domestic spending has been resilient. Productivity growth is strong, and capital investment is robust. Job gains have kept pace with the workforce, and the unemployment rate has changed little. Inflation remains elevated. The accumulation of more information will help the Committee determine the policy stance appropriate to ensure a timely return of inflation to the Committee’s 2% goal. The Committee will deliver price stability.”
연준 성명서 발췌: “경제 활동은 강한 속도로 확장되고 있습니다. 지정학적 전개 등으로 인해 불확실성이 여전히 높지만, 국내 지출은 회복력을 유지하고 있습니다. 생산성 증가세가 강하고 자본 투자가 견조합니다. 일자리 증가세는 노동력 증가 보조를 맞추고 있으며 실업률은 거의 변동이 없습니다. 인플레이션은 여전히 높은 수준입니다. 추가 정보가 축적되면 위원회는 인플레이션을 2% 목표로 적시에 되돌리기에 적절한 정책 기조를 결정하는 데 도움이 될 것입니다. 위원회는 물가 안정을 달성할 것입니다.”
For more on what Fed policy could mean for markets, read: Does the stock market test new Fed chairs? 🏛️ and ‘When will the Fed cut rates?’ is not the right question for investors right now ✂️
연준의 정책이 시장에 의미하는 바에 대해 더 알아보려면 다음 글을 읽어보세요: [연준 의장을 시험에 들게 하는 주식 시장이 있는가? 🏛️] 및 [‘연준이 언제 금리를 인하할 것인가?’는 지금 투자자들에게 올바른 질문이 아닙니다 ✂️]
🎈 Fed’s preferred inflation measure heat up. The personal consumption expenditures (PCE) price index in September was up 3.6% from a year ago. The core PCE price index — the Federal Reserve’s preferred measure of inflation — rose 3.1% during the month, up from August’s 3.0%.
🎈 연준이 선호하는 인플레이션 지표 상승세. 9월 개인소비지출(PCE) 물가지수는 전년 동기 대비 3.6% 상승했습니다. 연준이 선호하는 인플레이션 지표인 근원 PCE 물가지수는 해당 월에 3.1% 상승하여 8월의 3.0%보다 높아졌습니다.
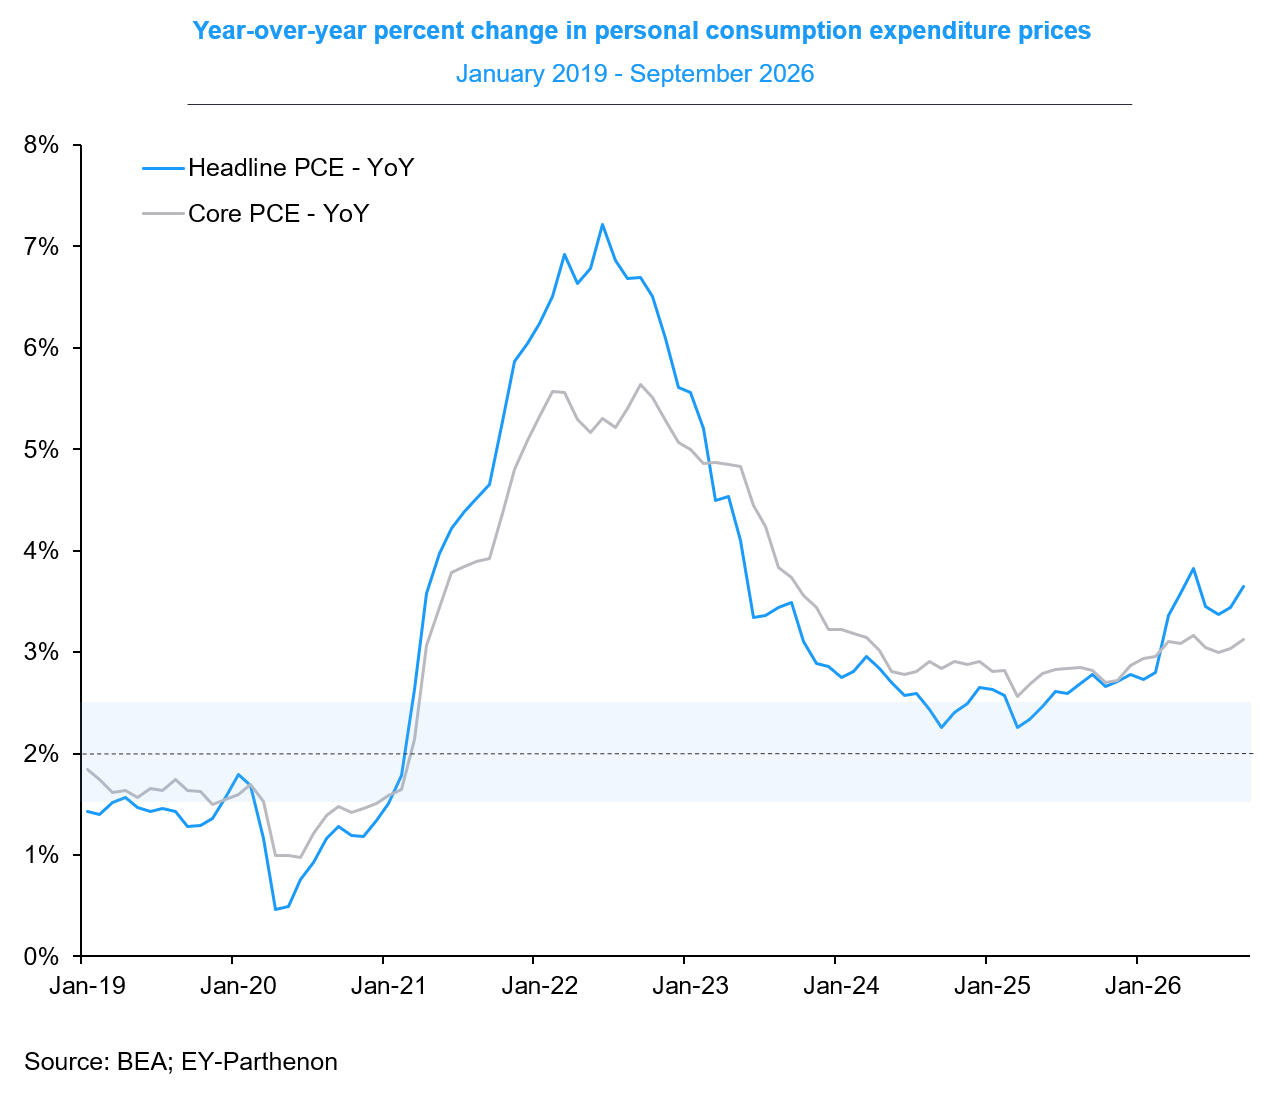
On a month-over-month basis, the core PCE price index was up 0.3%. If you annualize the three-month trend in the monthly figures — a reflection of the short-term trend in prices — core PCE climbed 2.9%.
전월 대비 기준으로 근원 PCE 물가지수는 0.3% 상승했습니다. 최근 월간 수치들의 3개월 추세를 연율화해보면(단기 물가 추세를 반영한 것), 근원 PCE는 2.9% 상승했습니다.
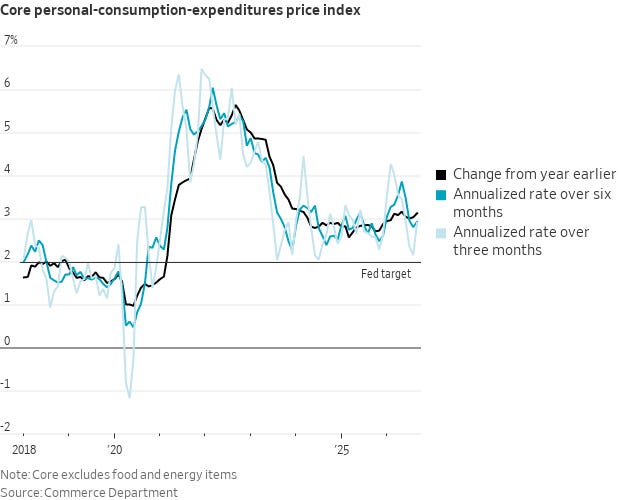
Inflation rates continue to trend above the Federal Reserve’s 2% target. How price trends evolve in the near term remains worth watching.
인플레이션율은 연준의 2% 목표치를 상회하는 흐름을 이어가고 있습니다. 단기적으로 물가 추세가 어떻게 전개될지 계속 지켜볼 가치가 있습니다.
For more on the Fed’s impact on markets, read: ‘When will the Fed cut rates?’ is not the right question for investors right now ✂️
연준이 시장에 미치는 영향에 대해 더 알아보려면 다음 글을 읽어보세요: [‘연준이 언제 금리를 인하할 것인가?’는 지금 투자자들에게 올바른 질문이 아닙니다 ✂️]
🛍️ Consumer spending ticks higher. BEA data show personal consumption expenditures rose 0.5% month-over-month in September to an annual rate of $22.5 trillion, an all-time high.
🛍️ 소비자 지출 소폭 증가. 미 상무부 경제분석국(BEA) 데이터에 따르면 9월 개인소비지출(PCE)은 전월 대비 0.5% 증가하여 연환산 기준 22조 5,000억 달러를 기록하며 사상 최고치를 경신했습니다.
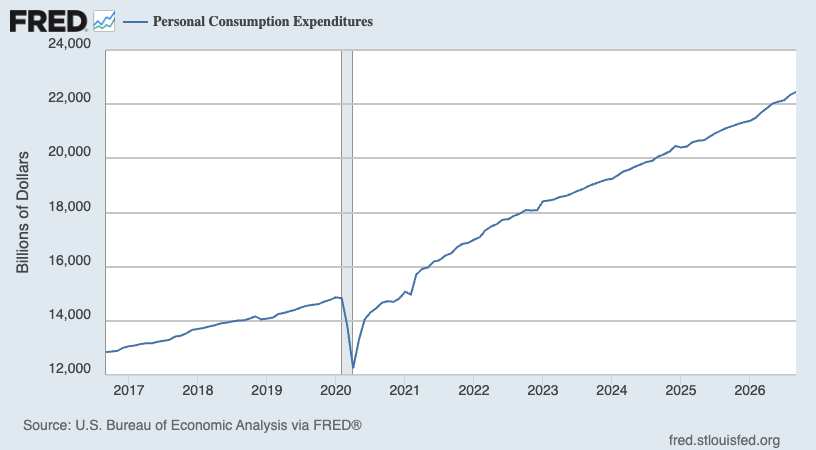
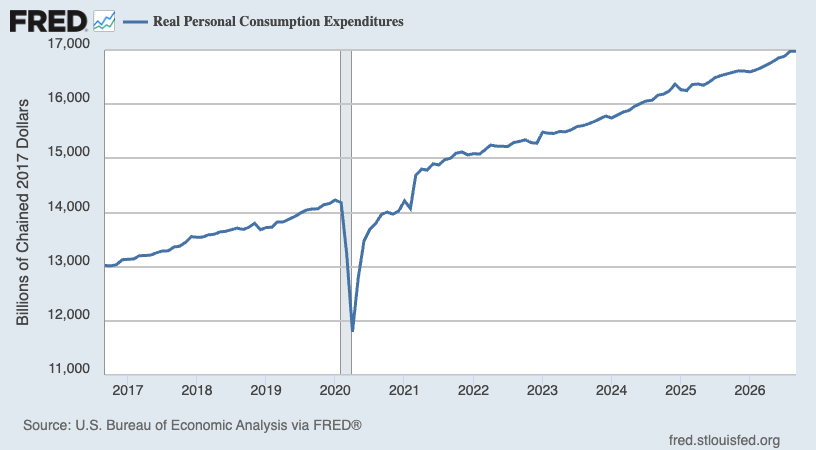
Adjusted for inflation, real personal consumption expenditures was unchanged from the prior month’s all-time high.
인플레이션을 감안한 실질 개인소비지출은 전월의 사상 최고치 수준에서 변동이 없었습니다.
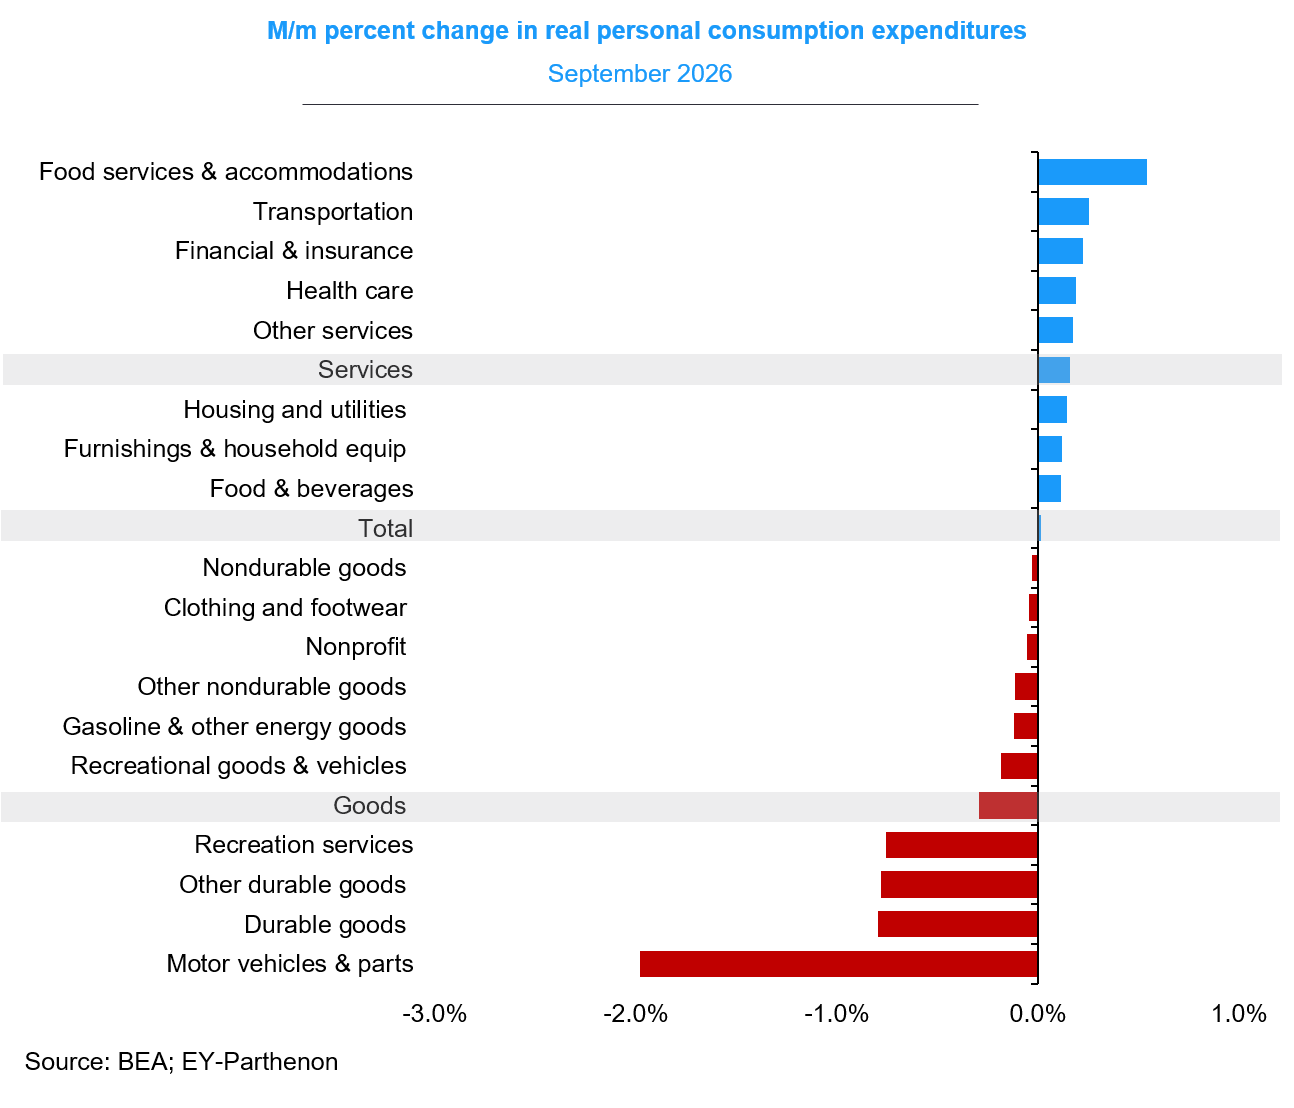
Here’s a breakdown of real spending growth by category.
부문별 실질 지출 증가 세부 내역은 다음과 같습니다.
For more on the economy, read: Fortunately, it’s not all bad news 📰
경제에 대해 더 알아보려면 다음 글을 읽어보세요: [다행히도 모든 소식이 나쁜 것은 아닙니다 📰]
💰The personal saving rate is low, but that’s not obviously a bad sign. Personal saving — disposable personal income minus personal consumption — has been shrinking over the past two years, causing the personal saving rate — personal saving as a percentage of disposable personal income — to trend lower. In September, the saving rate was 3.8%, its lowest level since Oct. 2022.
💰 개인 저축률은 낮지만, 그것이 명백히 나쁜 신호는 아닙니다. 가처분 개인 소득에서 개인 소비를 뺀 개인 저축은 지난 2년 동안 감소해 왔으며, 이로 인해 가처분 개인 소득 대비 개인 저축의 비율인 개인 저축률도 하향세를 그리고 있습니다. 9월 저축률은 3.8%로 2022년 10월 이후 최저 수준을 기록했습니다.
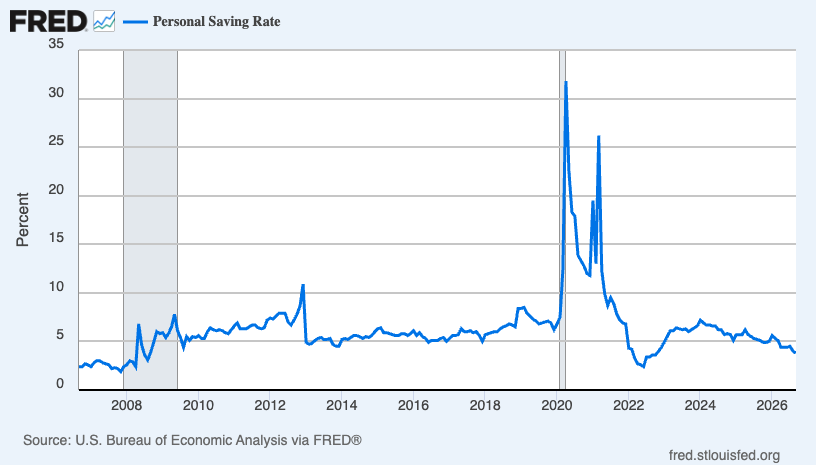
All else equal, this is not great. The implication is that more people are drawing from their savings to support their spending amid inflationary pressures. However, the saving rate tends to decline when net worths are rising. And net worths have been rising, driven by record-high home prices and elevated stock prices.
다른 조건이 동일하다면 이는 별로 좋지 않은 소식입니다. 인플레이션 압박 속에서 지출을 충당하기 위해 저축을 꺼내 쓰는 사람들이 늘어나고 있음을 시사하기 때문입니다. 하지만 저축률은 순자산이 증가할 때 하락하는 경향이 있습니다. 그리고 기록적인 주택 가격과 높은 주가에 힘입어 순자산은 증가해 왔습니다.
For more on this dynamic, read: A contrarian note about the falling personal saving rate 💸
이러한 역학 관계에 대해 더 알아보려면 다음 글을 읽어보세요: [하락하는 개인 저축률에 대한 역발상적 시각 💸]
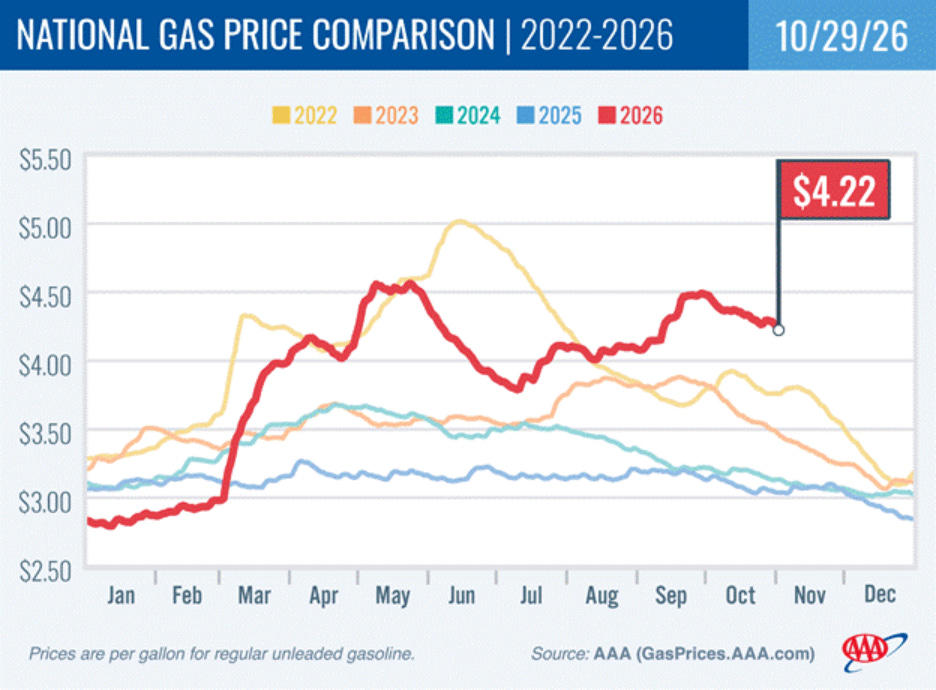
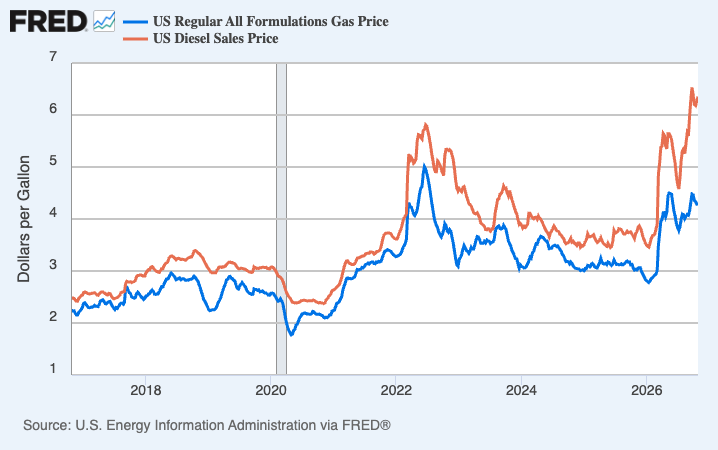
⛽️ Gas prices tick lower, but remain high. From AAA: “The national average for a gallon of regular gasoline fell 5 cents over the past week to $4.22. Crude oil prices above $100 per barrel, however, are limiting further declines at the pump. As drivers fuel up for the weekend, AAA reminds them that Saturday’s trick-or-treating and the end of daylight saving time Sunday call for extra care behind the wheel. With pedestrians out for Halloween and earlier evening darkness ahead, drivers should slow down, put distractions away and watch carefully at crosswalks and in neighborhoods.”
⛽ 휘발유 가격은 소폭 하락했으나 여전히 높은 수준 유지. 전미자동차협회(AAA)에 따르면: “전국 레귤러 휘발유 갤런당 평균 가격은 지난주 동안 5센트 하락한 4.22달러를 기록했습니다. 그러나 배럴당 100달러를 웃도는 원유 가격이 주유소에서의 추가 가격 하락을 제한하고 있습니다. 주말을 맞아 운전자들이 주유에 나서는 가운데, AAA는 토요일의 트릭 오어 트릿(trick-or-treating) 행사와 일광절약시간제(서머타임)가 끝나는 일요일을 맞아 운전 중 각별한 주의를 당부했습니다. 핼러윈을 맞아 거리에 보행자가 많아지고 저녁 어둠이 일찍 찾아오는 만큼, 운전자들은 속도를 줄이고 주의를 산만하게 하는 요인을 멀리하며 횡단보도와 주거 지역을 세심하게 살펴야 합니다.”
Here’s a longer-term look at gas and diesel price trends, as tracked by the EIA.
에너지정보청(EIA)이 추적한 휘발유 및 디젤 가격 추이의 장기적인 모습은 다음과 같습니다.
For more on energy prices, read: Our love-hate relationship with rising oil prices in charts 💔🛢️📊
에너지 가격에 대해 더 알아보려면 다음 글을 읽어보세요: [차트로 보는 유가 상승과의 애증 관계 💔🛢️📊]
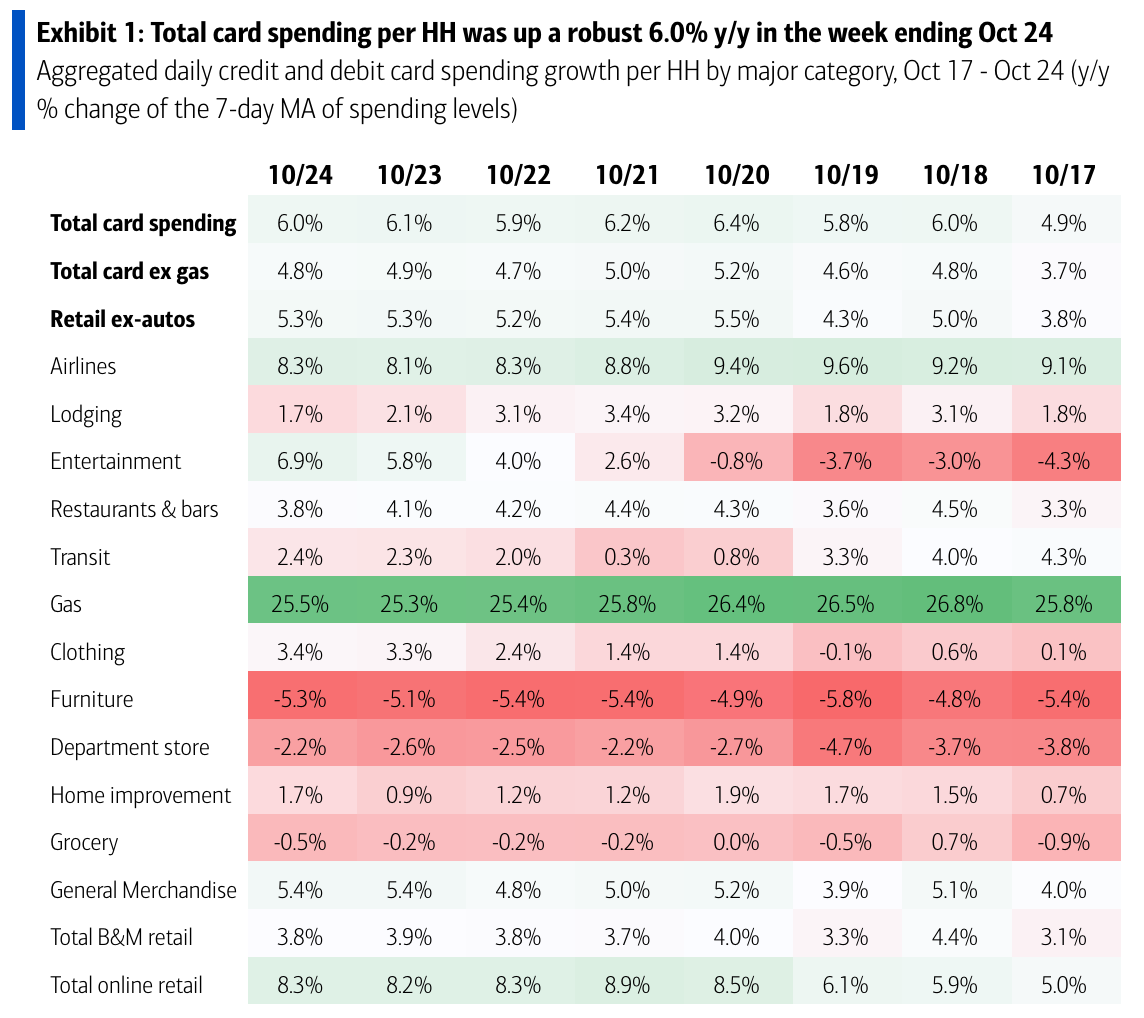
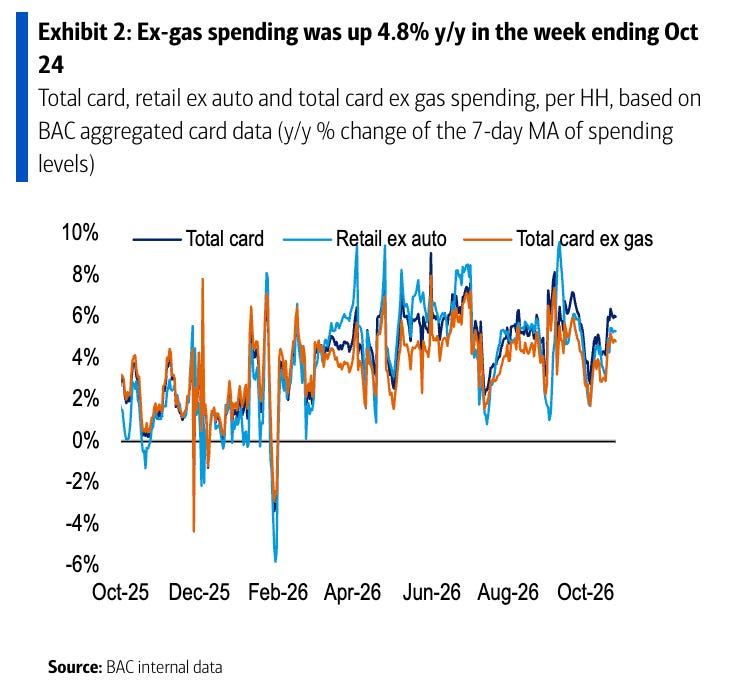
💳 Card spending data is holding up. From BofA: “Total card spending per HH was up 6.0% y/y in the week ending Oct 24, according to BAC aggregated credit & debit card data. Spending growth strengthened broadly relative to last week, led by entertainment, clothing, and online retail. Lower-income spending growth has consistently outpaced higher-income spending growth over the past several weeks.”
💳 카드 지출 데이터는 견조한 흐름 유지. 뱅크오브아메리카(BofA)에 따르면: “BAC의 신용·체크카드 종합 데이터에 따르면, 10월 24일로 끝난 주의 가구당 총 카드 지출은 전년 동기 대비 6.0% 증가했습니다. 엔터테인먼트, 의류, 온라인 소매업을 중심으로 지난주에 비해 지출 증가세가 전반적으로 강화되었습니다. 저소득층의 지출 증가세는 지난 몇 주 동안 고소득층의 지출 증가세를 꾸준히 상회했습니다.”
Consumer spending data has looked a lot better than consumer sentiment readings. For more on this contradiction, read: We’re taking that vacation whether we like it or not 🛫 and Household finances are both ‘worse’ and ‘good’ 🌦️
소비자 지출 데이터는 소비자 심리 지수보다 훨씬 더 양호한 모습을 보여왔습니다. 이러한 모순에 대해 더 알아보려면 다음 글을 읽어보세요: [원하든 원하지 않든 우리는 휴가를 떠납니다 🛫] 및 [가계 재정은 '악화'되기도 하고 '좋아지기도' 했습니다 🌦️]
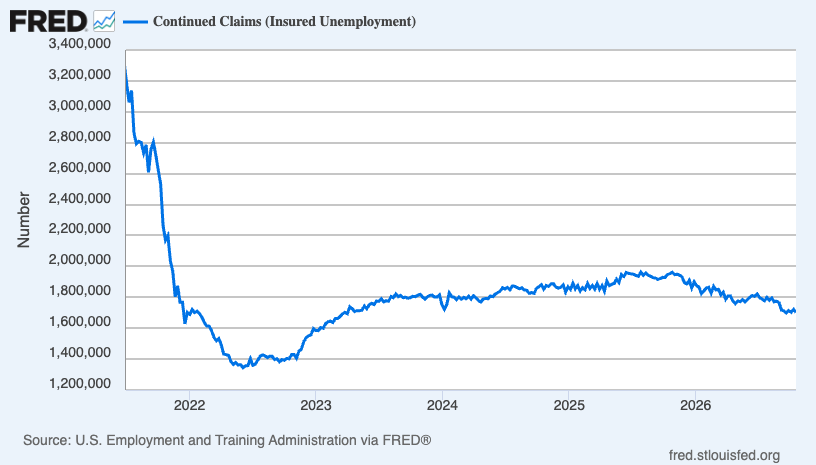
💼 New unemployment insurance claims, total ongoing claims remain low. Initial claims for unemployment benefits ticked down to 194,000 during the week ending Oct. 24, down from 195,000 the week prior. This metric remains at levels historically associated with economic growth.
💼 신규 실업보험 청구 건수 및 총 계속 청구 건수 낮은 수준 유지. 10월 24일로 끝난 주 동안 실업 혜택 초기 청구 건수는 직전 주의 19만 5,000건에서 19만 4,000건으로 소폭 감소했습니다. 이 지표는 역사적으로 경제 성장과 연관된 수준을 유지하고 있습니다.
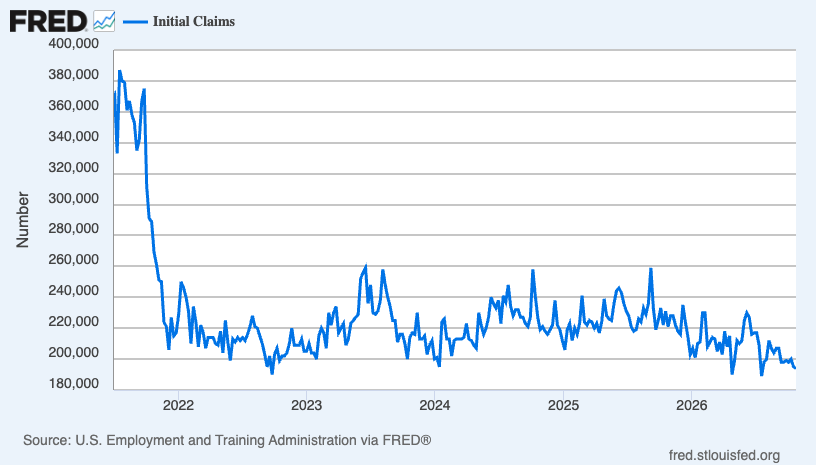
Insured unemployment, which captures those who continue to claim unemployment benefits, declined to 1.70 million during the week ending Oct. 17.
계속해서 실업 혜택을 청구하는 이들을 집계하는 피보험 실업자 수는 10월 17일로 끝난 주 동안 170만 명으로 감소했습니다.
For more on the labor market, read: Why mass tech layoffs have little effect on total employment 💾
노동 시장에 대해 더 알아보려면 다음 글을 읽어보세요: [대규모 기술 기업 해고가 전체 고용에 미치는 영향이 미미한 이유 💾]
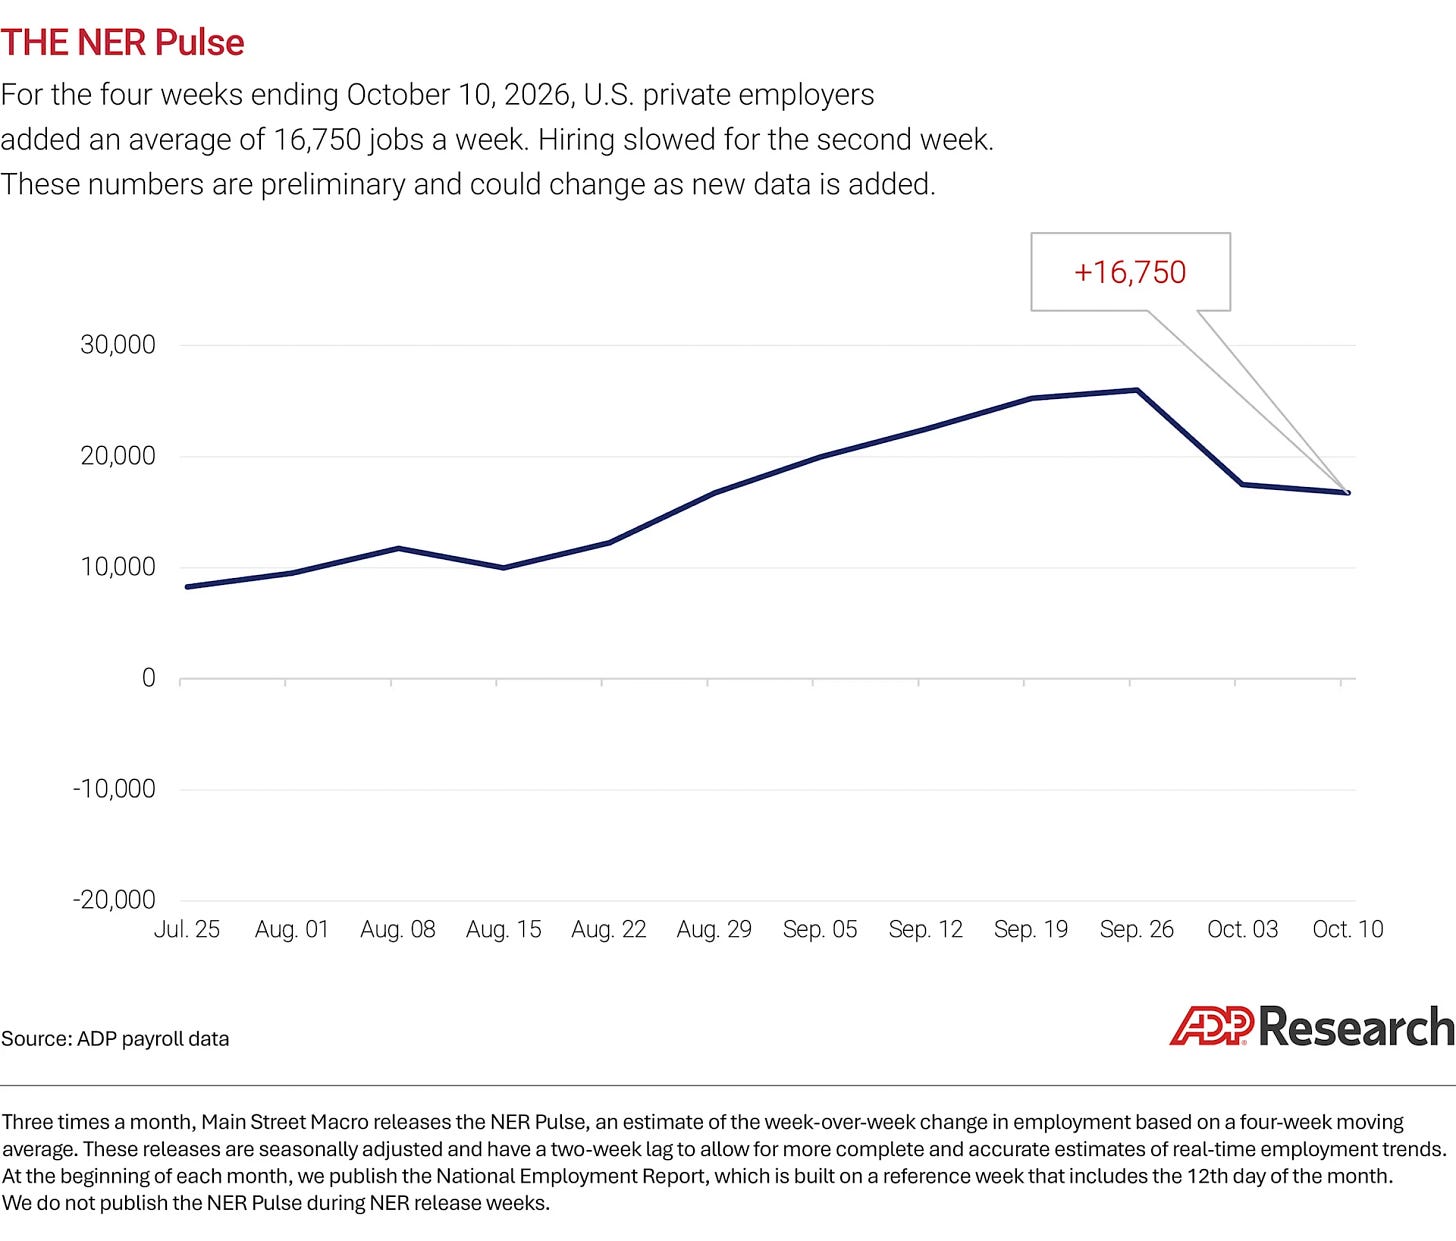
🤔 Recent private job growth is positive. According to payroll processor ADP, private U.S. employers added 16,750 jobs in the four weeks ending Oct. 10.
🤔 최근 민간 일자리 증가세는 양(+)의 방향. 급여 처리 업체인 ADP에 따르면, 미국 민간 고용주들은 10월 10일로 끝난 4주 동안 16,750개의 일자리를 추가했습니다.
For more on the labor market, read: Things are looking up in the labor market 👍
노동 시장에 대해 더 알아보려면 다음 글을 읽어보세요: [상승세를 보이는 노동 시장 👍]
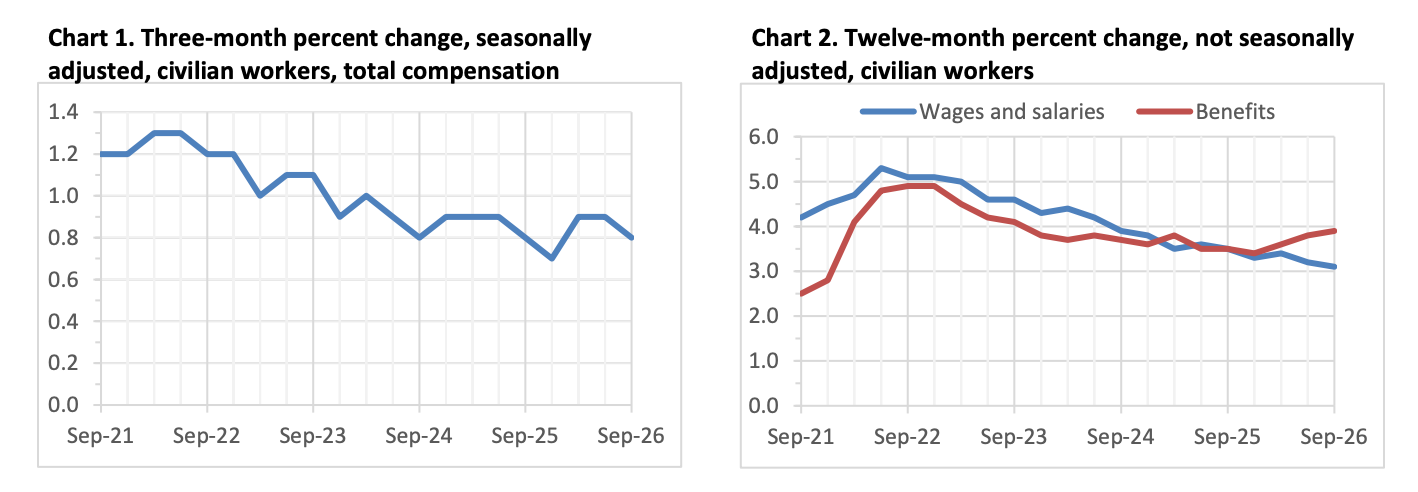
💵 Key labor costs metric was stable. The employment cost index in Q3 was up 0.8% from the prior quarter.
💵 핵심 인건비 지표 안정세 기록. 3분기 고용비용지수(ECI)는 전분기 대비 0.8% 상승했습니다.
For more on why policymakers are watching wage growth, read: Revisiting the key chart to watch amid the Fed's war on inflation 📈
정책 입안자들이 임금 상승률을 주시하는 이유에 대해 더 알아보려면 다음 글을 읽어보세요: [연준의 인플레이션과의 전쟁 속에서 주목해야 할 핵심 차트 다시 보기 📈]
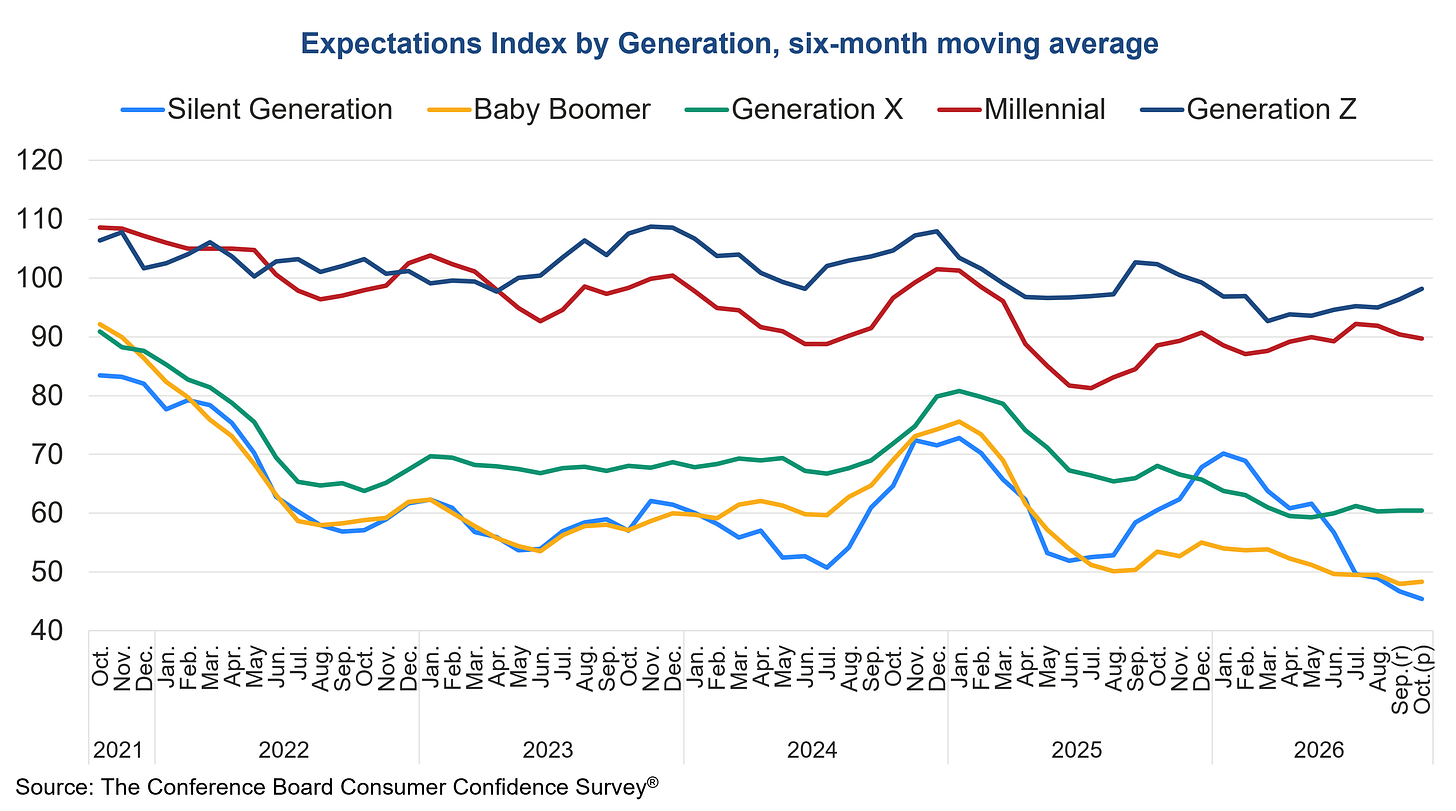
👎 Consumer vibes tick higher, but remain weak. The Conference Board’s Consumer Confidence Index rose by 7.5 points in October. From the report: “The recovery was in line with retail gasoline prices easing from September to October. Yet, despite the increase in October, consumer confidence remained on the long-term downward trend that’s persisted over the past few years. Consumers planned less spending on services and durable goods over the next six months. This likely reflected higher price levels and persistent inflation, which eroded consumers’ purchasing power.”
👎 소비자 체감 경기는 소폭 반등했으나 여전히 부진. 콘퍼런스보드(The Conference Board)의 소비자신뢰지수는 10월에 7.5포인트 상승했습니다. 보고서 내용 발췌: “이번 반등은 9월에서 10월 사이 소매 휘발유 가격이 하락한 것과 맞물려 있습니다. 그러나 10월의 상승에도 불구하고 소비자 신뢰도는 지난 몇 년 동안 지속되어 온 장기적 하락세를 이어갔습니다. 소비자들은 향후 6개월 동안 서비스 및 내구재 지출을 줄일 계획인 것으로 나타났습니다. 이는 소비자들의 구매력을 약화시킨 더 높은 물가 수준과 지속되는 인플레이션을 반영한 것으로 보입니다.”
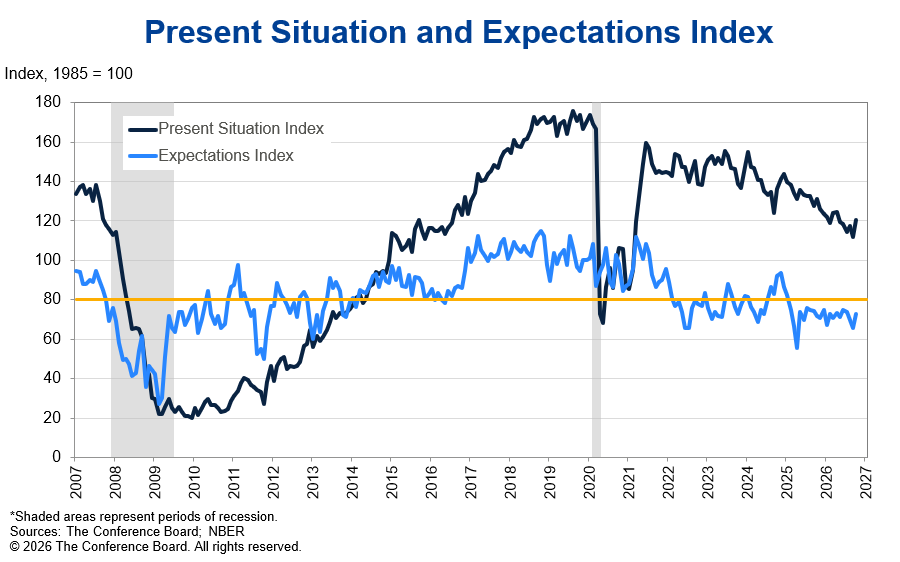
More from the report: “On a six-month moving average basis, only consumers under age 35 and those with a household income of $100k or more expressed an increase in confidence. By generation, confidence amongst Gen X, Baby Boomers, and the Silent Generation continued to trail significantly behind Gen Z and Millennials, widening a sharp generational divide that has emerged over the past two years. In October, confidence improved across all political affiliations—but much more so for Republicans.”
보고서 내용 추가 발췌: “6개월 이동평균 기준으로는 35세 미만 소비자들과 가구 소득이 10만 달러 이상인 소비자들만 신뢰도가 상승했다고 답했습니다. 세대별로 보면 X세대, 베이비부머, 침묵의 세대 내 신뢰도는 Z세대와 밀레니얼 세대에 비해 계속해서 크게 뒤처져 있으며, 지난 2년 동안 대두된 가파른 세대 갈등을 심화시켰습니다. 10월에는 모든 정치 성향에서 신뢰도가 개선되었으나, 공화당 지지층에서 훨씬 더 크게 개선되었습니다.”
For more on consumer sentiment, read: What consumers do > what consumers say 🙊 and The economy may not be working for everyone right now, but it’s at least working for stock market investors 🎭
소비자 심리에 대해 더 알아보려면 다음 글을 읽어보세요: [소비자가 하는 말보다 소비자가 하는 행동이 중요하다 🙊] 및 [지금 경제가 모든 이에게 작동하고 있지는 않지만, 적어도 주식 시장 투자자들에게는 작동하고 있습니다 🎭]
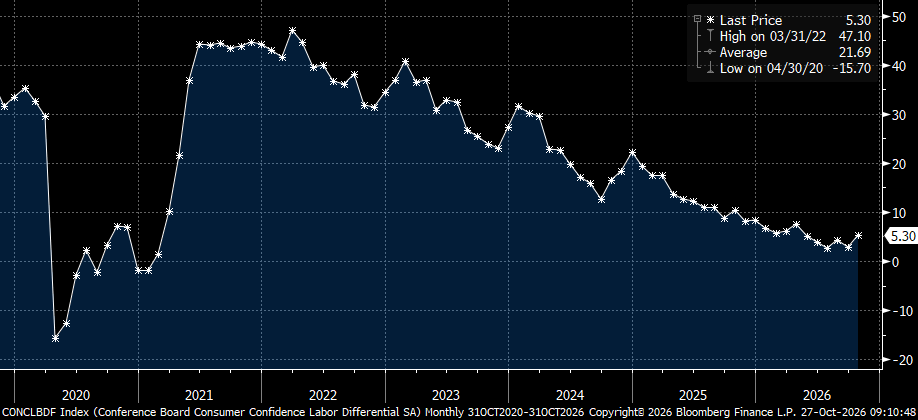
👎 Consumers feel only slightly better about the labor market. From The Conference Board: “Consumers’ views of the labor market were more positive in October: 26.7% of consumers said jobs were ‘plentiful,’ up from 24.3% in September. 21.4% of consumers said jobs were ‘hard to get,’ remaining unchanged.”
👎 노동 시장에 대한 소비자의 체감은 겨우 소폭 개선. 콘퍼런스보드에 따르면: “10월 소비자의 노동 시장에 대한 시각은 좀 더 긍정적으로 변했습니다. 일자리가 ‘풍부하다’고 답한 소비자는 9월의 24.3%에서 26.7%로 상승했습니다. 일자리를 ‘구하기 어렵다’고 답한 소비자는 21.4%로 변동이 없었습니다.”
Many economists monitor the spread between these two percentages (a.k.a., the labor market differential). The direction of the spread reflects a cooling sentiment toward the labor market.
많은 경제학자들은 이 두 비율 간의 격차(일명 노동 시장 격차, labor market differential)를 모니터링합니다. 이 격차의 방향은 노동 시장을 향한 냉각된 심리를 반영합니다.
More from The Conference Board: “Consumers were also somewhat less negative about the labor market outlook in October: 15.2% of consumers expected more jobs to be available, up from 14.7% in September. 26.3% expected fewer jobs, down from 27.6%.”
콘퍼런스보드 추가 발췌: “소비자들은 10월 노동 시장 전망에 대해서도 다소 덜 부정적인 반응을 보였습니다. 더 많은 일자리가 생길 것으로 기대한 소비자는 9월의 14.7%에서 15.2%로 상승했습니다. 더 적을 것으로 예상한 소비자는 27.6%에서 26.3%로 하락했습니다.”
For more on the labor market, read: Things are looking up in the labor market 👍
노동 시장에 대해 더 알아보려면 다음 글을 읽어보세요: [상승세를 보이는 노동 시장 👍]
🏠 Mortgage rates remain elevated. According to Freddie Mac, the average 30-year fixed-rate mortgage ticked down to 7.24%, down from 7.32% last week. It remains near the highest average rate since Nov. 2023.
🏠 주택담보대출(모기지) 금리 여전히 높은 수준 유지. 프레디맥(Freddie Mac)에 따르면, 30년 고정 모기지 평균 금리는 지난주 7.32%에서 소폭 하락한 7.24%를 기록했습니다. 이는 2023년 11월 이후 가장 높은 평균 금리 수준에 머물러 있습니다.
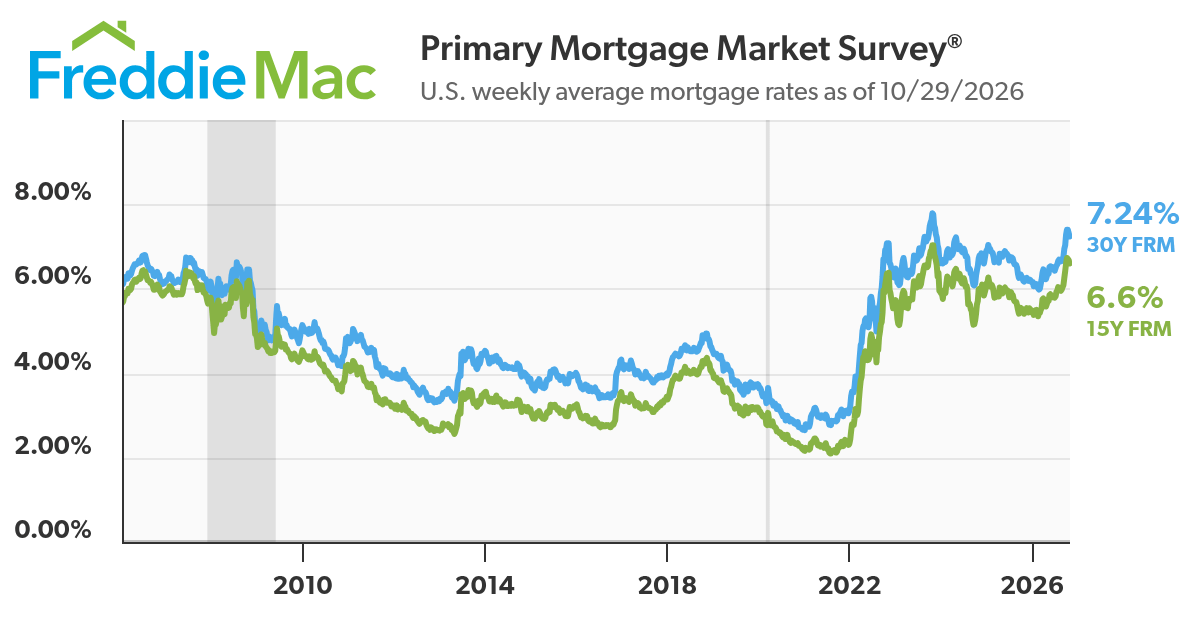
As of Q2, there were 149.5 million housing units in the U.S., of which 87.0 million were owner-occupied and about 40% were mortgage-free. Of those carrying mortgage debt, almost all have fixed-rate mortgages, and most of those mortgages have rates that were locked in before rates surged from 2021 lows. All of this is to say: Most homeowners are not particularly sensitive to the weekly movements in home prices or mortgage rates.
2분기 기준 미국의 주택 수는 1억 4,950만 채였으며, 이 중 8,700만 채가 자가 소유였고 약 40%는 모기지 부채가 없는 상태였습니다. 모기지 부채를 안고 있는 가구 중 대다수는 고정금리 모기지를 이용하고 있으며, 이들 대부분은 2021년 저금리 시기 이전에 금리를 고정해 둔 상태입니다. 이 말인즉슨: 대다수의 주택 소유자는 주택 가격이나 모기지 금리의 주간 변동에 크게 민감하지 않다는 뜻입니다.
For more on mortgages and home prices, read: Why home prices and rents are creating all sorts of confusion about inflation 😖
모기지와 주택 가격에 대해 더 알아보려면 다음 글을 읽어보세요: [주택 가격과 임대료가 인플레이션에 온갖 혼란을 야기하는 이유 😖]
🏘️ New home sales declined. Sales of newly built homes fell 0.6% in September to an annualized rate of 676,000 units.
🏘️ 신규 주택 판매 감소. 9월 신규 주택 판매량은 연환산 기준 67만 6,000채로 0.6% 감소했습니다.
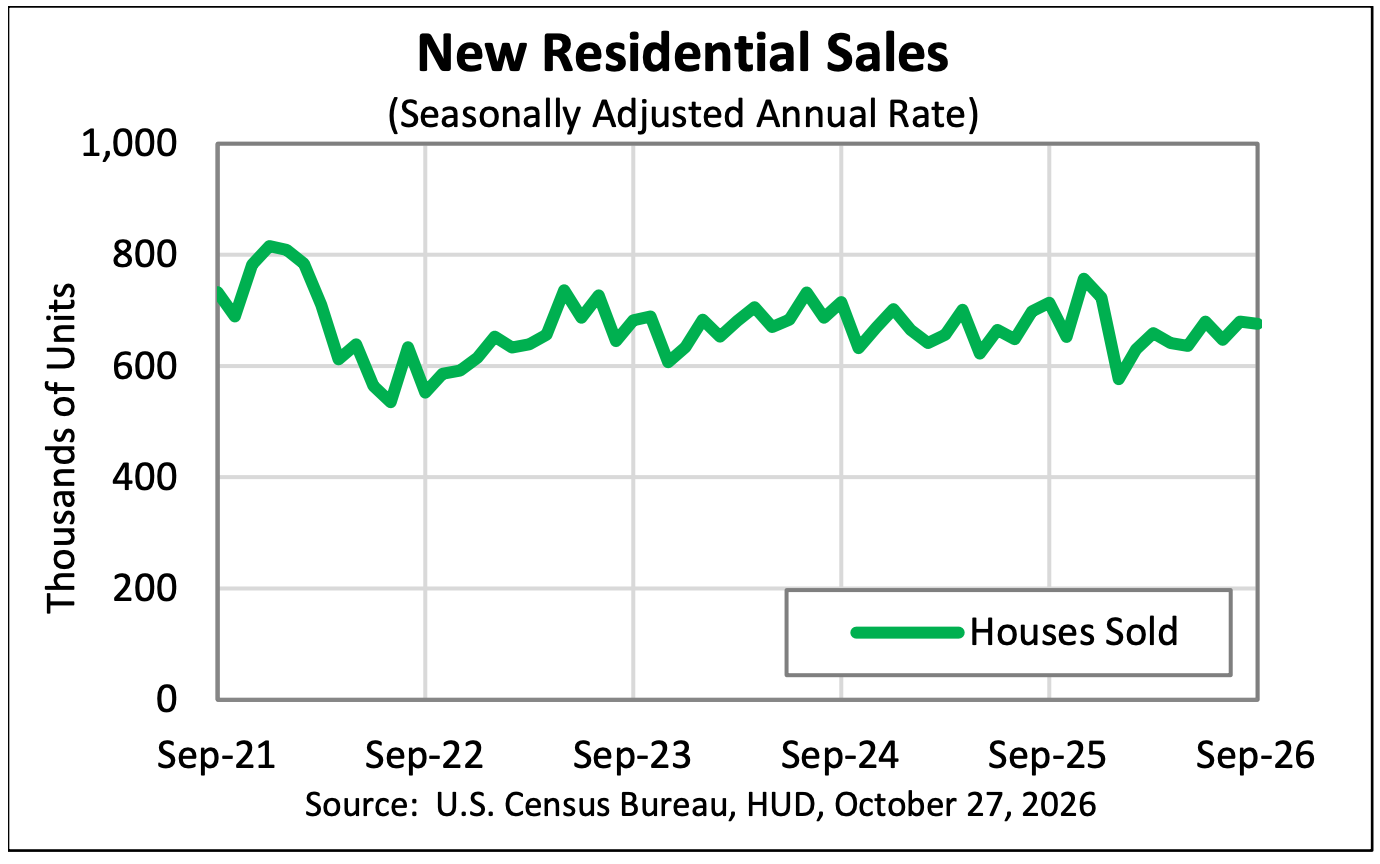
New home sales figures come with a large margin of error. For more on this, read: Mathematical context can totally change the story 🧮
신규 주택 판매 수치는 오차 범위가 큽니다. 이에 대해 더 알아보려면 다음 글을 읽어보세요: [수학적 맥락은 완전히 이야기를 바꿀 수 있습니다 🧮]
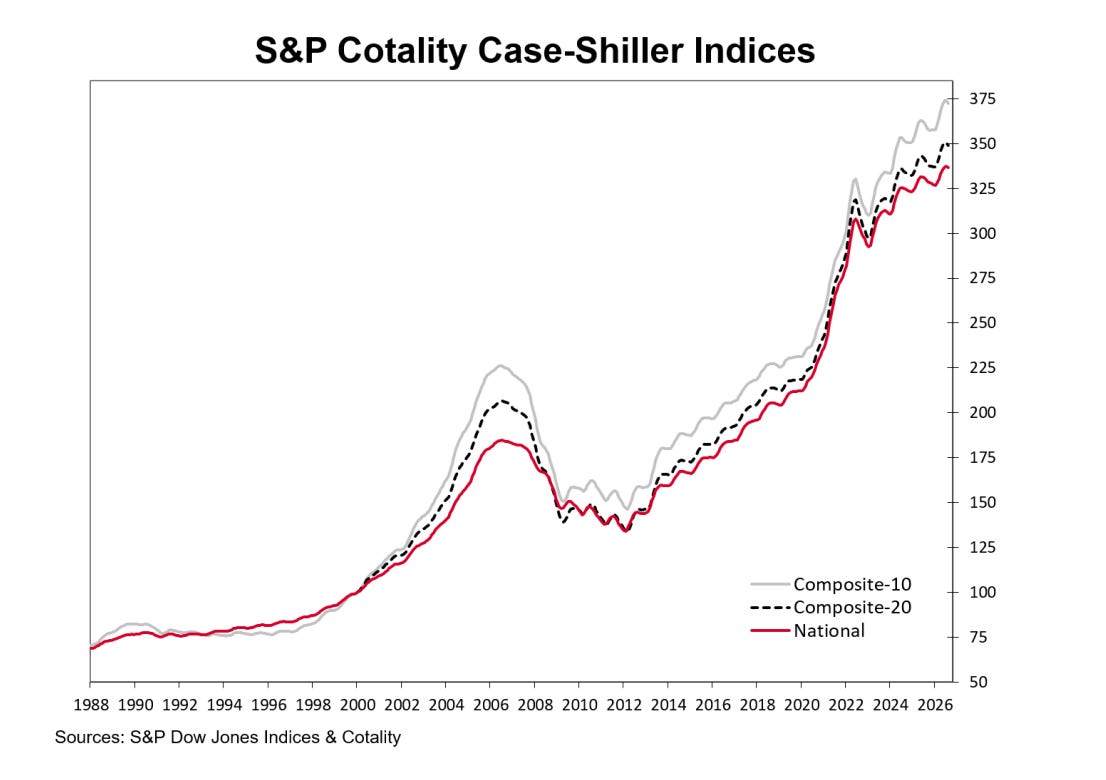
🏠 Home prices rose. According to the S&P CoreLogic Case-Shiller index, home prices were up 2.1% year-over-year in August and 0.3% month-over-month. From S&P Dow Jones Indices’ Rebecca Kaufman: “Affordability, however, remains challenging. With inflation at 3.4%, Brent crude near $100 per barrel and mortgage rates in the mid-to-high 6% range, households continue to face elevated costs alongside persistently high home prices.”
🏠 주택 가격 상승. S&P 코어로직 케이스-실러(S&P CoreLogic Case-Shiller) 지수에 따르면, 8월 주택 가격은 전년 동기 대비 2.1%, 전월 대비 0.3% 상승했습니다. S&P 다우존스 인덱스의 레베카 카우프만(Rebecca Kaufman)은 다음과 같이 전했습니다: “그러나 주택 구입 부담(Affordability)은 여전히 힘든 과제입니다. 인플레이션이 3.4%를 기록하고, 브렌트유가 배럴당 100달러 선에 머물며, 모기지 금리가 6% 중후반대에 머무는 상황에서 가계는 여전히 높은 주택 가격과 함께 누적되는 비용 부담에 직면해 있습니다.”
🏭 Business investment activity rose. Orders for nondefense capital goods excluding aircraft — a.k.a. core capex or business investment — increased 0.5% in September to a record $88.0 billion.
🏭 기업 투자 활동 증가. 항공기를 제외한 비국방 자본재 주문(일명 코어 자본재 또는 기업 투자)은 9월에 0.5% 증가하여 사상 최고치인 880억 달러를 기록했습니다.
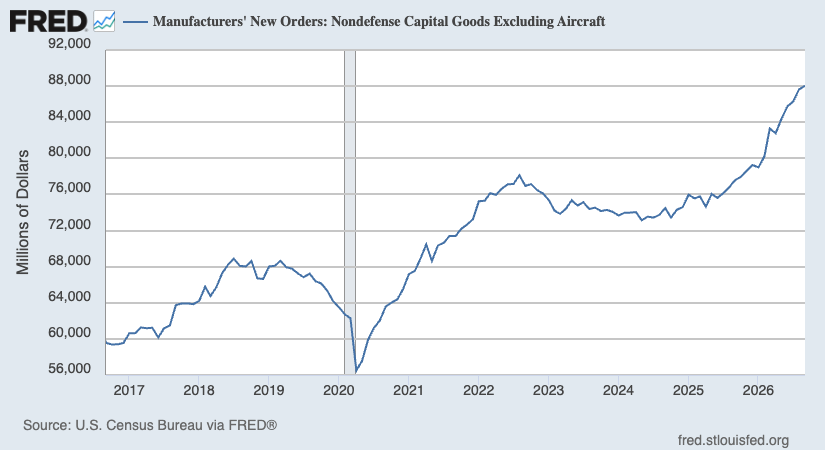
Core capex orders are a leading indicator, meaning they forecast future economic activity.
코어 자본재 주문은 선행 지표로, 향후 경제 활동을 예측해 주는 역할을 합니다.
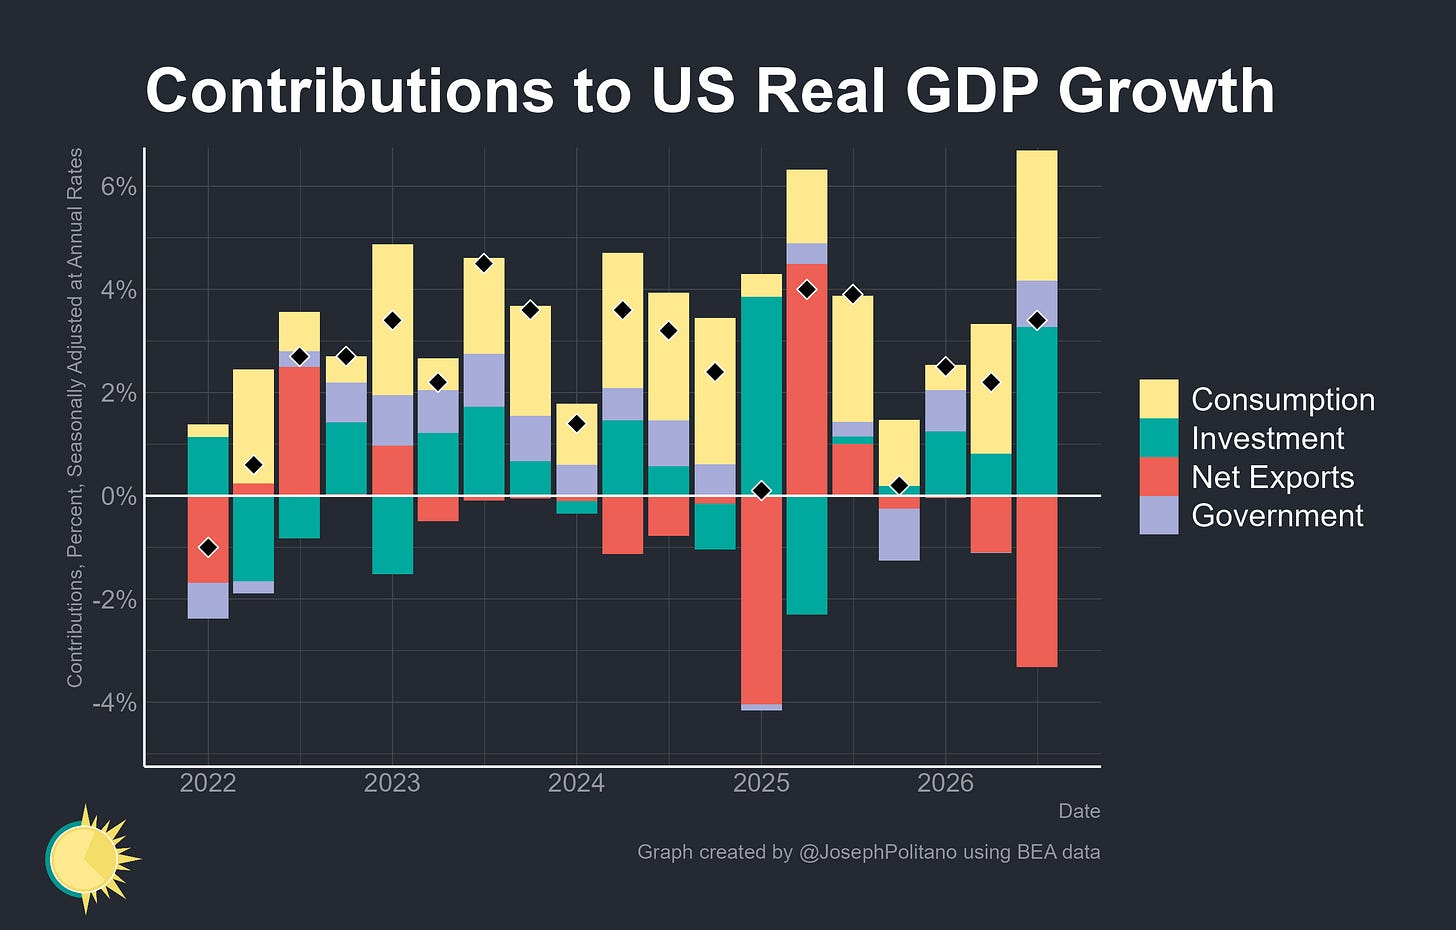
🐇 GDP growth picked up in Q3. U.S. GDP grew at a 3.4% rate in Q3, up from 2.2% in Q2. Consumption and investment led growth, more than offsetting the drag from a wider trade deficit.
🐇 3분기 GDP 성장세 확대. 미국의 3분기 실질 GDP는 2분기의 2.2%에서 3.4% 성장률로 확대되었습니다. 소비와 투장이 성장을 주도했으며, 무역 적자 확대에 따른 마이너스 요인을 상쇄하고도 남았습니다.
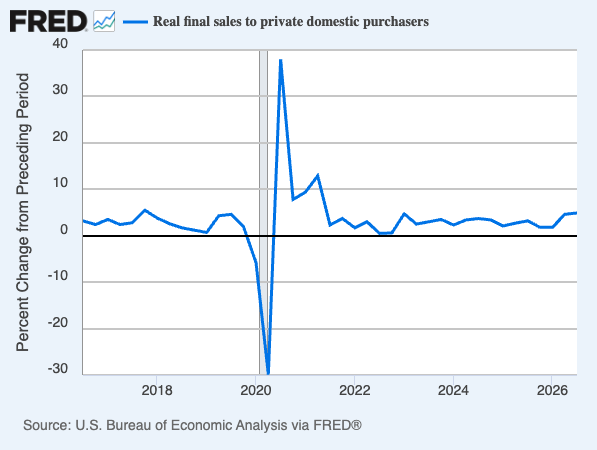
Because the GDP calculation has several quirks, economists often point to “real final sales to private domestic purchasers” to better understand the economy’s underlying health. Sometimes called “core” GDP, this metric excludes net exports, inventory adjustments, and government spending. That metric grew at a 4.9% rate in Q3.
GDP 계산에는 여러 특이성이 존재하기 때문에, 경제학자들은 경제의 기저 건강 상태를 더 잘 파악하기 위해 종종 ‘민간 국내 구매자에 대한 실질 최종 판매(real final sales to private domestic purchasers)’ 지표를 가리키곤 합니다. 일명 ‘코어’ GDP라고도 불리는 이 지표는 순수출, 재고 조정, 정부 지출을 제외합니다. 해당 지표는 3분기에 4.9%의 성장률을 기록했습니다.
For more on how GDP relates to the economy and the stock market, read: It’s too ambiguous to just say ‘the economy’ 🤦🏻♂️ and The stock market ≠ the economy ✋
GDP가 경제 및 주식 시장과 어떻게 연관되는지 더 알아보려면 다음 글을 읽어보세요: [단순히 ‘경제’라고 말하기에는 너무 모호합니다 🤦🏻♂️] 및 [주식 시장 $\neq$
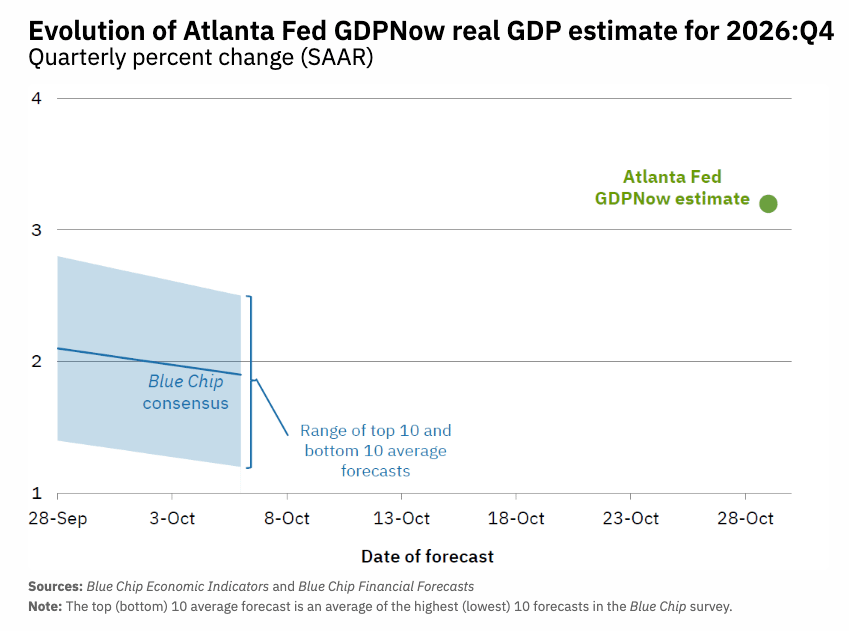
📈 Near-term GDP growth estimates are tracking positively. The Atlanta Fed’s GDPNow model sees real GDP growth rising at a 3.2% rate in Q4.
📈 단기 GDP 성장률 전망 긍정적. 애틀랜타 연은의 GDPNow 모델은 4분기 실질 GDP 성장률이 3.2%를 기록할 것으로 전망하고 있습니다.
For more on GDP and the economy, read: It’s too ambiguous to just say ‘the economy’ 🤦🏻♂️ and Economic data can often be both ‘worse’ and ‘good’ 🌦️
GDP와 경제에 대해 더 알아보려면 다음 글을 읽어보세요: [단순히 ‘경제’라고 말하기에는 너무 모호합니다 🤦🏻♂️] 및 [경제 데이터는 종종 ‘악화’된 것과 ‘좋은’ 것 양쪽 모두일 수 있습니다 🌦️]
Putting it all together 📋
Earnings look bullish: The long-term outlook for the stock market remains favorable, bolstered by expectations for years of earnings growth. And earnings are the most important driver of stock prices.
기업 실적은 낙관적: 주식 시장의 장기 전망은 수년간의 이익 성장에 대한 기대를 바탕으로 여전히 우호적입니다. 그리고 실적은 주가를 움직이는 가장 중요한 동력입니다.
Demand is positive: Demand for goods and services remains positive, supported by healthy consumer and business balance sheets. Personal spending activity remains at record levels. Core capex orders, which are a leading indicator of business spending, have been trending higher.
수요는 긍정적: 건강한 가계 및 기업 대차대조표의 뒷받침을 받아 재화와 서비스에 대한 수요는 긍정적으로 유지되고 있습니다. 개인 소비 활동은 사상 최고 수준을 이어가고 있습니다. 기업 지출의 선행 지표인 코어 자본재 주문은 상향 추세를 보이고 있습니다.
Growth rates have cooled: While the economy remains healthy, growth has normalized from much hotter levels earlier in the cycle. The economy is less “coiled” these days as major tailwinds like job openings and excess savings have faded. Job creation, while positive, is not as hot as it used to be. It has become harder to argue that growth is destiny.
성장률 냉정화: 경제는 여전히 건강하지만, 성장세는 경기 사이클 초기의 과열되었던 수준에서 정상화되었습니다. 구인 공고나 초과 저축 같은 주요 성장 동력이 약화되면서 최근 경제는 덜 과열된 상태입니다. 일자리 창출은 긍정적이기는 하나 예전만큼 뜨겁지는 않습니다. 성장이 곧 운명이라고 주장하기에는 어려워졌습니다.
Actions speak louder than words: We are in an odd period, as hard economic data has decoupled from soft, sentiment-driven data. Consumer and business sentiment has been relatively poor, even as tangible consumer and business activity continues to grow and trend at record levels. From an investor’s perspective, what matters is that the hard economic data holds up.
말보다 행동이 중요: 단단한 경제 데이터가 심리 중심의 부드러운 데이터와 디커플링(탈동조화)되는 기이한 시기에 직면해 있습니다. 가계와 기업의 실질적인 활동이 계속 성장하며 사상 최고치를 경신하고 있음에도 불구하고, 소비자 및 기업 심리는 상대적으로 부진했습니다. 투자자 관점에서 중요한 것은 단단한 경제 데이터가 잘 버텨주느냐 하는 점입니다.
Stocks are not the economy: There’s a case to be made that the U.S. stock market could outperform the U.S. economy in the near term, thanks largely to positive operating leverage. Since the pandemic, companies have aggressively adjusted their cost structures. This included strategic layoffs and investment in new equipment, including AI-powered hardware. These moves are driving positive operating leverage, meaning modest sales growth — in the cooling economy — translates into robust earnings growth.
주식 시장은 경제가 아님: 긍정적인 영업 레버리지(operating leverage) 덕분에 미국 주식 시장이 단기적으로 미국 경제를 아웃퍼폼(상회)할 가능성이 있습니다. 팬데믹 이후 기업들은 전략적 구조조정(전략적 해고 및 AI 기반 하드웨어를 포함한 신규 장비 투자 등)을 통해 비용 구조를 공격적으로 조정해 왔습니다. 이러한 움직임은 긍정적인 영업 레버리지를 이끌어내고 있으며, 이는 냉각되는 경제 속에서도 완만한 매출 성장이 탄탄한 이익 성장으로 직결됨을 의미합니다.
Mind the ever-present risks: We should not get complacent. There will always be risks to worry about, such as U.S. political uncertainty, geopolitical turmoil, energy price volatility, and cyberattacks. There are also the dreaded unknowns. Any of these risks can flare up and spark short-term market volatility.
상존하는 리스크 주의: 안주해서는 안 됩니다. 미국 정치적 불확실성, 지정학적 소용돌이, 에너지 가격 변동성, 사이버 공격 등 우려해야 할 리스크는 언제나 존재합니다. 두려운 미지의 요인들도 있습니다. 이러한 리스크 중 어느 것이든 불거져 나와 단기적인 시장 변동성을 촉발할 수 있습니다.
Investing is never a smooth ride: Economic recessions and bear markets are harsh realities that all long-term investors should expect as they build wealth in the markets. Always keep your stock market seat belts fastened.
투자는 결코 순탄치 않음: 경기 침체와 약세장은 장기 투자자가 부를 축적하는 과정에서 마주하게 될 가혹한 현실입니다. 항상 주식 시장 안전벨트를 단단히 매고 계세요.
Think long-term: For now, there’s no reason to believe the economy and the markets will face a challenge they can’t overcome. The long game remains undefeated, and long-term investors can expect that streak to continue.
장기적 관점 유지: 현재로서는 경제와 시장이 극복하지 못할 난관에 직면할 것이라 믿을 만한 이유는 없습니다. ‘장기 게임’은 여전히 불패이며, 장기 투자자들은 그 기록이 계속 이어질 것으로 기대할 수 있습니다.
For more on how the macro story is evolving, check out the previous review of the macro crosscurrents. »
거시경제적 흐름이 어떻게 전개되고 있는지 더 알아보려면 이전 거시경제 엇갈림 현상 점검 내용을 확인해 보세요. »