Using AI for Root Cause Analysis of Simulation Failures
I’ve been working with AMIQ EDA for almost nine years now, writing about their cool technologies and interviewing users about their experiences. I’ve read through more user guides and release notes than I can count. I’ve watched many dozens of video clips showing how to use their products. I’ve even visited their headquarters in Bucharest multiple times to sit with their engineers and learn what’s on the horizon. I can honestly say that, across all this interaction, nothing has impressed me quite as much as the capabilities shown in a recent demo.
저는 거의 9년 동안 AMIQ EDA와 함께 일하며 그들의 멋진 기술에 대해 글을 쓰고, 사용자들을 인터뷰하며 경험을 나누었습니다. 세어 볼 수 없을 만큼 많은 사용자 가이드와 릴리스 노트를 읽었고, 제품 사용법을 보여주는 수십 편의 동영상을 시청했습니다. 심지어 루마니아 부쿠레슈티에 있는 본사를 여러 차례 방문해 엔지니어들과 마주 앉아 앞으로의 계획에 대해 듣기도 했습니다. 솔직히 말씀드리면, 이 모든 소통을 통틀어 최근 시연(demo)에서 목격한 기능만큼 깊은 인상을 준 것은 없었습니다.
One reason this particular demo is so interesting is that it entails the use of AI to help with a common and challenging aspect of semiconductor development. Like many others, I’m constantly impressed by how rapidly and how deeply AI is changing this industry. In fact, some engineers are concerned that the use of generative AI (GenAI) to produce design and verification code will degrade their skills or make their jobs so boring that they’ll no longer find them worth pursuing.
이 특정 시연이 그토록 흥미로운 이유 중 하나는 반도체 개발 과정에서 흔히 겪는 까다로운 난제에 AI를 활용하기 때문입니다. 저를 포함한 많은 사람들이 AI가 이 산업을 얼마나 빠르고 깊숙이 변화시키고 있는지 거듭 감탄하고 있습니다. 실제로 일부 엔지니어들은 생성형 AI(GenAI)를 이용해 설계 및 검증 코드를 작성하게 되면 자신의 기술이 저하되거나 업무가 너무 지루해져 더 이상 추구할 가치를 느끼지 못하게 될까 봐 우려하기도 합니다.
They should not however, worry about the role of AI in automating routine, repetitive, and sometimes tedious tasks that take up a good portion of a chip engineer’s day. Anything that makes humans more productive and enables them to spend more time on the creative aspects of their jobs sounds like a win to me. Debugging simulation test failures is one of those tasks that takes a lot of time and effort. The “aha!” moment when a verification engineer finds the exact root cause of a failure is rewarding. All the juggling of files and alignment of timelines leading up to that is much less interesting.
하지만 칩 엔지니어 하루 업무의 상당 부분을 차지하는 루틴하고 반복적이며 때로는 지루한 태스크를 자동화하는 데 AI가 수행하는 역할에 대해서는 걱정할 필요가 없습니다. 인간의 생산성을 높여주고 업무의 창의적인 측면에 더 많은 시간을 쏟을 수 있게 해주는 그 어떤 기술이든 저에게는 환영할 만한 일입니다. 시뮬레이션 테스트 실패를 디버깅하는 일이야말로 시간과 노력이 엄청나게 소모되는 그런 태스크 중 하나입니다. 검증 엔지니어가 실패의 정확한 근본 원인을 찾아냈을 때 찾아오는 "아하!" 하는 순간은 보람찹니다. 하지만 그에 이르기까지 거치는 수많은 파일 저글링과 타임라인 정렬 작업은 훨씬 덜 흥미롭습니다.
That’s exactly the part of the process that AMIQ EDA has focused on. This demo shows how their DVT waveform and log analysis tools power AI-driven test failure root cause analysis (RCA). A typical testbench based on the Universal Verification Methodology (UVM) standard is highly complex. The simulation tests that run in this environment to verify huge chip designs generate very large log and signal change (waveform) files. Each test failure must be debugged to find out whether it is due to a flaw in the design or an error in the testbench. This is often a tedious, multi-step process:
- Find the UVM error in the log file
- Correlate the failure to the source code
- Trace the issue across both the testbench and design hierarchy
- Manually add signals to a waveform view to see how they evolved during the test
- Piece together what went wrong and find the precise error
- Make a trial fix and re-run the test to see if the error disappears
바로 이 과정의 일부분에 AMIQ EDA가 집중했습니다. 이번 시연은 그들의 DVT 파형(waveform) 및 로그 분석 툴이 어떻게 AI 기반 테스트 실패 근본 원인 분석(RCA, Root Cause Analysis)을 구동하는지 보여줍니다. 보편적 검증 방법론(UVM, Universal Verification Methodology) 표준을 기반으로 하는 전형적인 테스트벤치는 극도로 복잡합니다. 거대한 칩 설계를 검증하기 위해 이 환경에서 실행되는 시뮬레이션 테스트는 매우 방대한 양의 로그 및 신호 변화(파형) 파일을 생성합니다. 각 테스트 실패는 설계 결함 때문인지 테스트벤치 오류 때문인지 밝혀내기 위해 반드시 디버깅되어야 합니다. 이는 종종 지루하고 여러 단계로 이루어지는 프로세스입니다.
- 로그 파일에서 UVM 오류 찾기
- 실패 현상을 소스 코드와 상호 연관시키기
- 테스트벤치와 설계 계층 구조 양쪽에서 문제 추적하기
- 테스트 중 신호가 어떻게 진화했는지 확인하기 위해 파형 뷰에 수동으로 신호 추가하기
- 무엇이 잘못되었는지 조합하여 정확한 오류 찾아내기
- 임시 수정(trial fix)을 적용하고 테스트를 재실행하여 오류가 사라지는지 확인하기
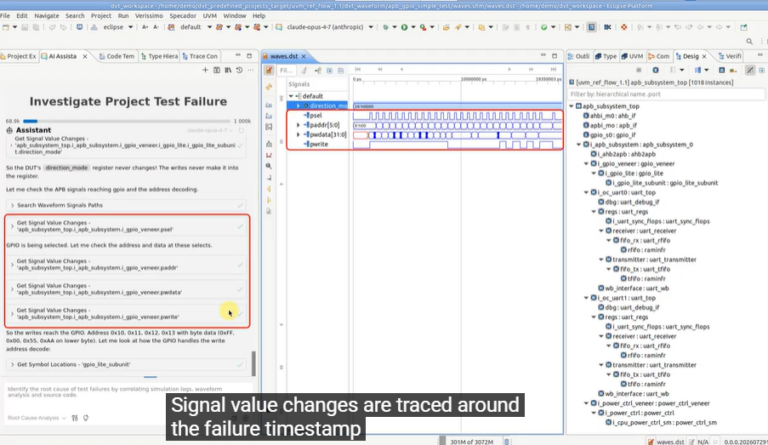
At some point during the fifth step, the process gets interesting and the “aha!” moment comes. Everything leading up to that can be automated by AI, and that’s what the demo shows. The Root Cause Analysis profile in the AMIQ EDA DVT AI Assistant orchestrates a specialized AI agent to drive the entire debug workflow autonomously. The verification engineer simply opens the AI Assistant panel, selects the profile, and types in a simple prompt such as “investigate the test failure.”
5단계 중 어느 시점에 이르면 프로세스가 흥미로워지고 "아하!" 하는 순간이 찾아옵니다. 그에 선행하는 모든 과정은 AI로 자동화될 수 있으며, 이번 시연은 바로 그것을 보여줍니다. AMIQ EDA DVT AI 어시스턴트의 근본 원인 분석 프로필은 특화된 AI 에이전트를 조율하여 전체 디버깅 워크플로우를 자율적으로 구동합니다. 검증 엔지니어는 단순히 AI 어시스턴트 패널을 열고 프로필을 선택한 뒤, "테스트 실패를 조사해 줘(investigate the test failure)"와 같은 간단한 프롬프트를 입력하기만 하면 됩니다.
As the demo shows, the agent starts by identifying the correct log and waveform files. The log file tool parses the raw simulation log into structured UVM messages, allowing AI to instantly sort, filter, and isolate the preceding events that triggered the failure. The waveform tool then selects relevant signals in the waveform file and investigates value changes and causal relationships around the timestamp of the failure. This allows it to reconstruct a timeline of events leading up to the failures.
시연에서 볼 수 있듯이, 에이전트는 올바른 로그 및 파형 파일을 식별하는 것으로 시작합니다. 로그 파일 툴은 원시 시뮬레이션 로그를 구조화된 UVM 메시지로 파싱하여, AI가 실패를 유발한 선행 이벤트들을 즉시 정렬, 필터링, 격리할 수 있도록 합니다. 그런 다음 파형 툴은 파형 파일에서 관련 신호를 선택하고 실패 타임스탬프 주변의 값 변화와 인과 관계를 조사합니다. 이를 통해 실패로 이어진 이벤트들의 타임라인을 재구성할 수 있습니다.
The AI agent queries the waveform for changes of relevant signals at key timestamps. It also uses compiler-backed code navigation to explore the source code and to understand both the verification environment and the underlying design hierarchy. The final output is a nicely formatted, highly structured report. It displays a chronological step-by-step chain of events with timestamped evidence linking log messages directly to waveform data. Clickable hyperlinks allow the users to instantly cross-correlate the data and zoom in quickly on the root cause of the failure.
AI 에이전트는 주요 타임스탬프에서 관련 신호의 변화를 파악하기 위해 파형을 쿼리합니다. 또한 컴파일러 기반 코드 내비게이션을 사용하여 소스 코드를 탐색하고 검증 환경과 기반 설계 계층 구조를 모두 이해합니다. 최종 결과물은 깔끔하게 포맷되고 고도로 구조화된 보고서입니다. 이 보고서는 로그 메시지를 파형 데이터와 직접 연결하는 타임스탬프가 찍힌 증거와 함께 시간순의 단계별 이벤트 체인을 보여줍니다. 사용자는 클릭 가능한 하이퍼링크를 통해 데이터를 즉시 교차 상관(cross-correlate)하고 실패의 근본 원인으로 빠르게 확대(zoom in)할 수 있습니다.
I was impressed by how much routine busywork this automation eliminates. My main question was how this capability is made available. I learned that it is included within AMIQ EDA DVT IDE for both Visual Studio (VS) Code and Eclipse users. What’s really interesting is that external AI agents can also access this root cause analysis solution via the AMIQ EDA DVT MCP Server. In an external agent such as Cursor, Claude Code, Codex, Copilot or Kiro., a user can install the companion skills, start the MCP Server, and execute a very similar debug query.
이 자동화가 얼마나 많은 루틴한 번거로운 업무를 없애주는지 보고 깊은 인상을 받았습니다. 저의 주된 의문은 이 기능을 어떻게 이용할 수 있는가 하는 점이었습니다. 알아보니 이는 Visual Studio(VS) Code와 Eclipse 사용자 모두를 위한 AMIQ EDA DVT IDE 내부에 포함되어 있다고 합니다. 정말 흥미로운 점은 외부 AI 에이전트도 AMIQ EDA DVT MCP 서버를 통해 이 근본 원인 분석 솔루션에 액세스할 수 있다는 것입니다. Cursor, Claude Code, Codex, Copilot 또는 Kiro 같은 외부 에이전트에서 사용자는 컴패니언 스킬을 설치하고, MCP 서버를 시작하며, 매우 유사한 디버그 쿼리를 실행할 수 있습니다.
It seems to me that this demo shows exactly what AI does best: automating routine tasks and presenting complex information in a way that allows humans to make better decisions. DVT AI Assistant’s Root Cause Analysis profile orchestrates an AI agent that parses simulation logs, explores waveforms, and navigates source code to produce a structured, evidence-backed failure report. The AMIQ EDA team informed me that this impressive RCA capability is evolving and improving constantly. I’d love to hear what others think of this video demo in the comments section.
이번 시연은 AI가 가장 잘하는 일, 즉 루틴한 태스크를 자동화하고 인간이 더 나은 의사결정을 내릴 수 있도록 복잡한 정보를 제시하는 것을 정확하게 보여준다고 생각합니다. DVT AI 어시스턴트의 근본 원인 분석 프로필은 시뮬레이션 로그를 파싱하고, 파형을 탐색하며, 소스 코드를 내비게이팅하여 구조화되고 증거가 뒷받침되는 실패 보고서를 생성하는 AI 에이전트를 조율합니다. AMIQ EDA 팀은 이 인상적인 RCA 기능이 지속적으로 진화하고 개선되고 있다고 전했습니다. 댓글란을 통해 다른 분들은 이 비디오 시연을 어떻게 보셨는지 의견을 꼭 들어보고 싶습니다.